News

By Sam Collentine, Meteorologist Updated 6 months ago October 17, 2023
El Niño & La Niña, Explained

You often hear weather forecasters begin their discussion about the upcoming winter forecast by looking at the current state of the El Niño-Southern Oscillation (ENSO). So what is ENSO, El Niño, and La Niña?
What is ENSO?
El Niño-Southern Oscillation (ENSO) refers to the year-to-year variations in sea-surface temperatures, convective rainfall, surface air pressure, and atmospheric circulation that occur across the equatorial Pacific Ocean.
El Niño and La Niña represent opposite extremes in the ENSO cycle, while ENSO-Neutral refers to the state between El Niño and La Niña.

ENSO is one of the most important climate phenomena on Earth due to its ability to change the global atmospheric circulation, which in turn, influences temperature and precipitation across the globe.
What is El Niño?
The term El Niño refers to the large-scale ocean-atmosphere climate phenomenon linked to periodic warming in sea-surface temperatures across the central and east-central equatorial Pacific.
El Niño represents the warm phase of the ENSO cycle and means that the ocean water temperatures are warmer than average.
El Niño was originally recognized by fishermen off the coast of South America in the 1600s, with the appearance of unusually warm water in the Pacific Ocean.
The name El Niño, or 'Christ child', was chosen because these warm-water events happened to around the Christmas holiday.
What is La Niña?
The term La Niña refers to the large-scale ocean-atmosphere climate phenomenon linked to periodic cooling in sea-surface temperatures across the central and east-central equatorial Pacific.
La Niña represents the cool phase of the ENSO cycle and means that the ocean water temperatures are cooler than average.
What is ENSO-Neutral?
The term ENSO-neutral refers to periods when El Niño and La Niña are not present and typically occur during the transition between El Niño and La Niña events.
The ocean water temperatures over the equatorial Pacific Ocean are near the long-term average.
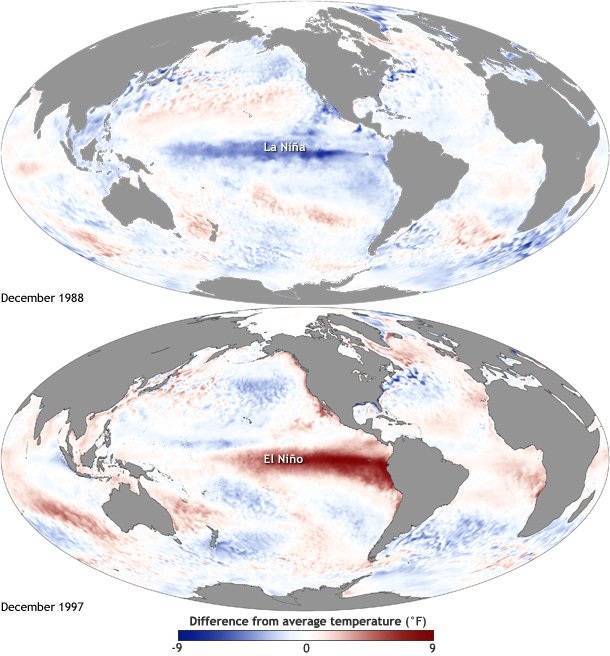
Images of El Niño & La Niña
The images below (courtesy of NOAA) show ocean water temperature compared to average in the Pacific Ocean.
The top image is La Niña, showing cooler than average ocean water temperature. The bottom image is El Niño, showing warmer than average ocean water temperature.
How do we measure ENSO?
The first ENSO indicator is the Southern Oscillation Index (SOI), which is calculated using the pressure differential between Tahiti and Darwin. The SOI is negative during El Niño years and positive during La Niña years.
The second ENSO indicator comes from the National Oceanic and Atmospheric Administration (NOAA). NOAA maintains monitoring buoys called the Tropical Atmosphere Ocean (TAO) Array across the equatorial Pacific Ocean.
The buoys record and transmit sea surface and sub-surface temperatures, atmospheric conditions, water currents, and wind data to scientists and researchers around the world in real-time.
El Niño & La Niña Alert System
On the second Thursday of each month, scientists with NOAA’s Climate Prediction Center, in collaboration with forecasters at the International Research Institute for Climate and Society (IRI), release an official update on the status of the El Niño-Southern Oscillation (ENSO).
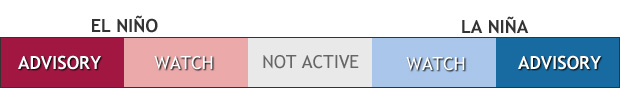
Watch: Issued when conditions are favorable for the development of El Niño or La Niña conditions within the next six months.
Advisory: Issued when El Niño or La Niña conditions are observed and expected to continue.
Final Advisory: Issued after El Niño or La Niña conditions have ended.
Not Active: ENSO Alert System is not active. Neither El Niño nor La Niña are observed or expected in the coming 6 months.
El Niño Criteria
1) The average sea surface temperatures in the Niño-3.4 region of the equatorial Pacific Ocean were at least 0.5°C (0.9°F) warmer than average in the preceding month.
2) The average anomaly of at least 0.5°C (0.9°F) has persisted or is expected to persist for 5 consecutive, overlapping 3-month periods.
La Niña Criteria
1) The average sea surface temperatures in the Niño-3.4 region of the equatorial Pacific Ocean were at least 0.5°C (0.9°F) cooler than average in the preceding month.
2) The average anomaly of at least -0.5°C (-0.9°F) has persisted or is expected to persist for 5 consecutive, overlapping 3-month periods.
Why do we care about El Niño & La Niña?
Ocean water temperatures across the world influence the tracks of winter storms.
One area of ocean water temperature that has the biggest impact on winter storms in North America is the central Pacific Ocean. This is the location of El Nino and La Nina.
Thanks to decades of research, scientists now have a decent ability to predict the strength of El Nino and La Nina months in advance.
This means that even now in late summer, we are looking ahead to the temperature of the ocean during the upcoming winter, and it's these water temperatures that can influence the tracks of our winter storms.
Typical El Niño & La Niña Winter Weather Patterns
The following maps (courtesy of NOAA) illustrate the typical impacts of El Niño and La Niña on the United States during the winter.
During La Niña, the Pacific jet stream often meanders high into the North Pacific and is less reliable across the southern tier of the United States. Southern and interior Alaska and the Pacific Northwest tend to be cooler and wetter than average and the southern tier of U.S. tends to be warmer and drier than average.
During El Niño, the Pacific jet stream will often dip further south across the southern tier of the United States. The southern states tend to be cooler and wetter than average, while the northern half of the U.S. becomes warmer and drier than average.

Keep in mind that one or more of these climate patterns have occurred during many El Niño and La Niña events in the past. That doesn’t mean that all of these impacts happen during every episode as every event is different.
Final Thoughts
When it comes to skiing, it’s all about timing.
Booking a trip 7-10 days in advance and for a general area that looks stormy will increase your chances of scoring the best conditions.
If you're ready to level up your weather app for the upcoming winter season, consider upgrading to OpenSnow All-Access. Whether you’re chasing powder, searching for sunny days, or something in between, our 10-day snow forecasts, expert "Daily Snow" forecasters, and high-resolution weather maps have you covered.
But don't just take my word for it ... "Any weather app can give a mediocre forecast for a mountain town, but only OpenSnow provides a good idea of actual mountain conditions. It's a small price to pay ($29.99/year) for the best weather forecasts." – Real App Review
Download the free OpenSnow app for the most accurate snow forecast and snow report information and stay tuned to our weather forecasts for the latest updates.
Sam Collentine
About The Author
Sam Collentine
Meteorologist
Sam Collentine is the Chief Operating Officer of OpenSnow and lives in Basalt, Colorado. Before joining OpenSnow, he studied Atmospheric Science at the University of Colorado, spent time at Channel 7 News in Denver, and at the National Weather Service in Boulder.
Free OpenSnow App