Montana Daily Snow

Heads up, there may be fresher snow! Read the latest Montana Daily Snow

By Bob Ambrose, Forecaster Posted 7 months ago September 28, 2023

2023-2024 Montana Winter Forecast Preview

Summary

For the upcoming winter season, an El Niño looks to be in store and with current oceanic readings showing it gaining strength, it looks particularly potent. In this first post of the 2023-24 season, I’ll look at historical SWE numbers from the past 7 El Nino Winters at SNOTEL sites near 6 of Montana’s more popular areas/resorts to look for possible clues for what we might expect this winter.

Short Term Forecast

For the past three ski seasons the Northern Rockies were under a La Nina weather pattern. While 2020-21 and 2021-22 seasons were largely uneventful in the snowpack category, the 2022-23 La Nina winter really delivered a punch. This was most felt in the mountains east of the Continental Divide where well above average snowpacks were recorded at all resorts and ski areas. The mountains west of the Divide also did quite well, except for below average snowfall across NW Montana which rode north of the storm track during the second half of the season.

As we look ahead to the 2023-2024 winter season, it's important to remember that any winter outlook will contain an inherent degree of uncertainty. However, there are a few clues that we can keep an eye on thanks to historical weather data available on the weather phenomenon called El Niño.

El Niño, Explained

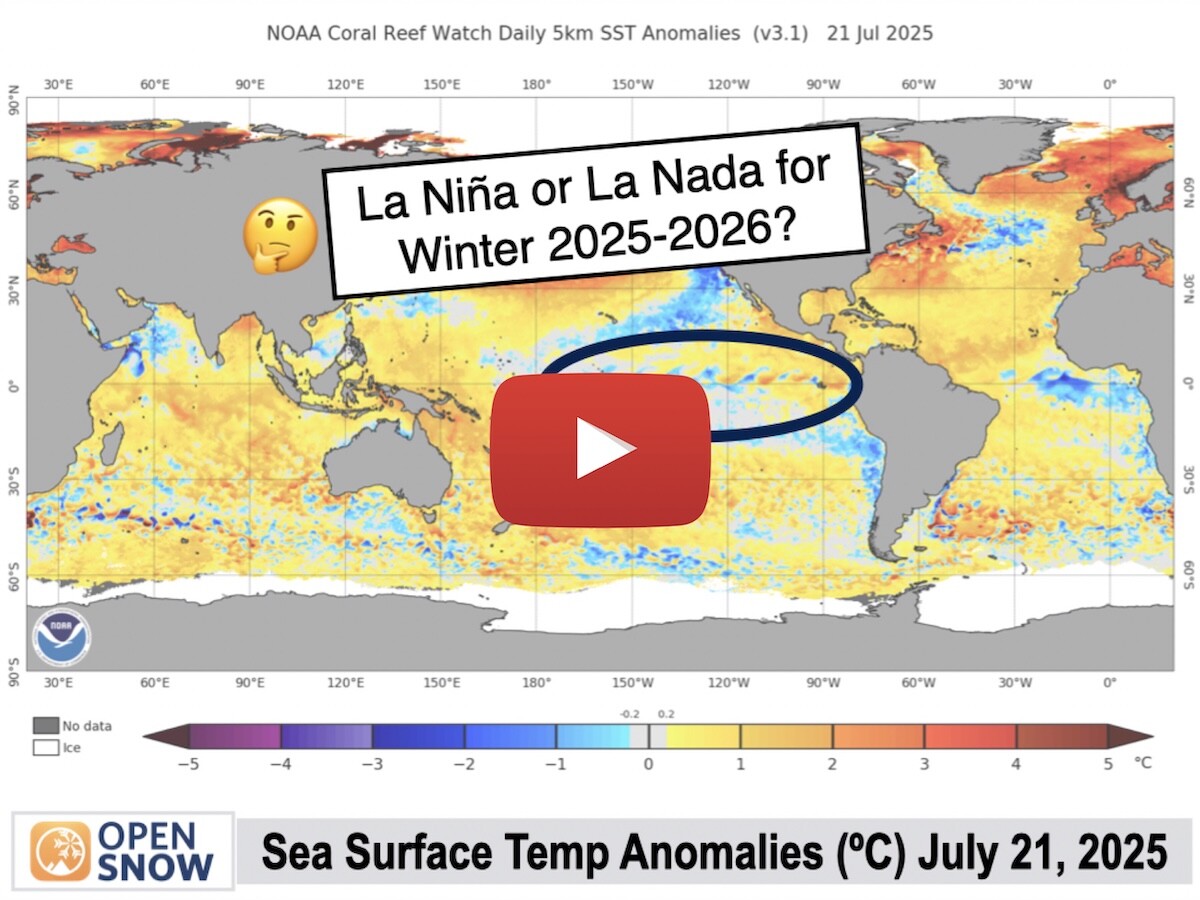
The term El Niño refers to the large-scale ocean-atmosphere climate phenomenon linked to periodic warming in sea-surface temperatures across the central and east-central equatorial Pacific.

El Niño represents the warm phase of the ENSO cycle and means that the ocean water temperatures are warmer than average.

Ski Season Snowfall vs. El Niño

The map below shows winter snowfall during seven significant El Niño episodes across the United States. The higher the number, the stronger the El Niño. The blue dots are above average, the white dots are average, and the orange dots are below average snowfall.

The relationship tends not to deviate too much from the seasonal norms for El Niño and snowfall in Montana, with most of the state generally close to or slightly below average precipitation during the winter months. I will report on any trends made apparent from historical SWE (snow water equivalent) numbers from seven of the past El Nino winters in the Northern Rockies.  

WEST of the Continental Divide:

Historical El Niño Seasons @ Whitefish Mountain Resort

After looking back at the seven most recent significant El Niño years and comparing them against the 30-year median snow water equivalent (SWE) on March 31 of 36.1 inches at the Stahl Peak Snotel at 6030’ in the Whitefish Range just north of Big Mountain (Whitefish Mtn Resort), I've found that the median SWE near Whitefish during those El Niño years is 33.4 inches on March 31 or 92.5% compared to the 30-year normal.

SWE on March 31 During El Niño

  • 1991-2020: 36.1" (30-year normal)
  • 1982-1983: 36.3”
  • 1986-1987: 35.5”
  • 1991-1992: 26.1”
  • 1997-1998: 33.2”
  • 2002-2003: 33.5”
  • 2009-2010: 29.9”
  • 2015-2016: 39.5”

Two out of the seven El Niño years produced above-normal snow water equivalent (SWE) near Whitefish Mountain Resort on March 31.

For timing, when looking at the percentage change in SWE each month during the seven most recent significant El Niño episodes and comparing them against the 30-year median in SWE for that month...

  • November: 114%
  • December: 105%
  • January: 102%
  • February: 102%
  • March: 89%
  • April: 86%

It appears the El Nino seasons trend above normal from early to midwinter, while the late winter/spring months are below normal.

Historical El Niño Seasons @ Montana Snowbowl

After researching four of the most recent significant El Niño years (this Snotel did not start reporting data until 1994) and comparing them against the 30-year median snow water equivalent (SWE) on March 31 of 32.0 inches at the Stuart Mountain Snotel at 7400’ near Montana Snowbowl, I've found that the median SWE near Snowbowl on those reported four El Niño years is 27.3 inches on March 31 or 86% compared to the 30-year normal.

SWE on March 31 During El Niño

  • 1991-2020: 32.0” (30-year normal)
  • 1982-1983: No Data
  • 1986-1987: No Data
  • 1991-1992: No Data
  • 1997-1998: 24.4"
  • 2002-2003: 31.5"
  • 2009-2010: 23.4"
  • 2015-2016: 30.0"

None of the four El Niño years produced above-normal snow water equivalent (SWE) near Snowbowl on March 31, however the winters of 2002-03 and 2015-16 were very close to the median.  

For timing, when looking at the percentage change in SWE each month during these four most recent El Niño episodes and comparing them against the 30-year median in SWE for that month...

  • November: 87.5%
  • December: 67.2%
  • January: 76.1%
  • February: 80.0%
  • March: 87.0%
  • April: 84.5%

While below normal, it appears the median snowpack in SWE approaches “near normal” during November, then again later in the season in March and April.

Historical El Niño Seasons @ Lost Trail Powder Mountain

After looking back at the seven most recent significant El Niño years and comparing them against the 30-year median snow water equivalent (SWE) on March 31 of 23.0” inches at the Saddle Mountain Snotel at 7940’ I've found that the median SWE at Lost Trail during those El Niño years is 21.2 inches on March 31 or 92% compared to the 30-year normal.

SWE on March 31 During El Niño

  • 1991-2020: 23.0" (30-year normal)
  • 1982-1983: 25.7”
  • 1986-1987: 15.8”
  • 1991-1992: 19.8”
  • 1997-1998: 20.5”
  • 2002-2003: 28.5”
  • 2009-2010: 13.4”
  • 2015-2016: 24.8”

Three out of the seven El Niño years produced above-normal snow water equivalent (SWE) for Lost Trail on March 31.

For timing, when looking at the percentage change in SWE each month during the seven most recent significant El Niño episodes and comparing them against the 30-year median in SWE for that month...

  • November: 92%
  • December: 103%
  • January: 91%
  • February: 89%
  • March: 90%
  • April: 91%

The six winter months of the past seven El Nino winters at Lost Trail have tended to hover just below seasonal averages in SWE with December at slightly above average.


EAST of the Continental Divide:  

Historical El Niño Seasons @ Big Sky Resort

After looking back at the five most recent significant El Niño years (no data available for 82/83 and 86/87) and comparing them against the 30-year median snow water equivalent (SWE) on March 31 of 17.6” inches at the Lone Mountain Snotel at 8880’ I've found that the median SWE at Big Sky during those five El Niño years is 15.8 inches on March 31 or 90% compared to the 30-year normal.

SWE on March 31 During El Niño

  • 1991-2020: 17.6” (30-year normal)
  • 1982-1983: No Data
  • 1986-1987: No Data
  • 1991-1992: 12.4”
  • 1997-1998: 16.9”
  • 2002-2003: 18.0”
  • 2009-2010: 13.5"
  • 2015-2016: 18.1"

Two out of the five El Niño years reported produced above-normal snow water equivalent (SWE) for Big Sky on March 31.

For timing, when looking at the percentage change in SWE each month during the five most recent significant El Niño episodes and comparing them against the 30-year median in SWE for that month...

  • November: 113%
  • December: 94%
  • January: 86%
  • February: 86%
  • March: 91%
  • April: 90%

It tends to be a notch below historical seasonal SWE medians with November having produced above normal snowpack.

Historical El Niño Seasons @ Bridger Bowl  

After looking back at the four most recent significant El Niño years (no data was available for 82/83, 86/87, and 91-92) and comparing them against the 30-year median snow water equivalent (SWE) on March 31 of 20.8 inches at the Brackett Creek Snotel at 7320’ near Bridger Bowl, I've found that the median SWE near Bridger during those four El Niño years is 20.55 inches on March 31 or 98.8% compared to the 30-year normal.

SWE on March 31 During El Niño

  • 1991-2020: 20.8” (30-year normal)
  • 1982-1983: No Data
  • 1986-1987: No Data
  • 1991-1992: No Data
  • 1997-1998: 18.2”
  • 2002-2003: 22.7”
  • 2009-2010: 20.6”
  • 2015-2016: 20.7”

Only 2002-2003 of the four El Niño years reported produced above-normal snow water equivalent (SWE) near Bridger Bowl on March 31 with the other three El Nino episodes very close to normal.

For timing, when looking at the percentage change in SWE each month during these 4 most recent El Niño winters and comparing them against the 30-year median in SWE for that month...

  • November: 135%
  • December: 79%
  • January: 84%
  • February: 95%
  • March: 97%
  • April: 97%

It tends to be that November has seen well above normal numbers from the past four El Nino seasons while the rest of the winter months are slightly below or right at seasonal medians.

Historical El Niño Seasons @ Red Lodge Mountain

Over at Red Lodge Mountain, the Cole Creek Snotel at an elevation of 7850’ on the mountain’s backside has been reporting since 1960 and thus we can observe the full seven most recent El Niño years and compare them against the 30-year median snow water equivalent (SWE). On March 31 the 30-year median of 12.5 inches was reported at the Cole Creek Snotel, I've calculated that the median SWE at Red Lodge during those El Niño years is 15.75 inches on March 31 or 126% compared to the 30-year normal.

SWE on March 31 During El Niño

  • 1991-2020: 12.5” (30-year normal)
  • 1982-1983: 19.0”
  • 1986-1987: 18.1”
  • 1991-1992: 14.5”
  • 1997-1998: 13.3”
  • 2002-2003: 21.0”
  • 2009-2010: 13.6”
  • 2015-2016: 10.7”

Six out of the seven El Niño years produced above-normal snow water equivalent (SWE) for Red Lodge Mountain on March 31.

For timing, when looking at the percentage change in SWE each month during the seven most recent El Niño episodes and comparing them against the 30-year median in SWE for that month...

  • November: 149%
  • December: 146%
  • January: 115%
  • February: 116%
  • March: 105%
  • April: 127%

Except for the 2015-15 season, these historical readings are the most favorable I found across Montana, possibly due to Red Lodge Mountain being the most southerly of all Montana’s ski areas and resorts. El Nino winters historically tend to be stronger to the south of Montana. These numbers indicate that the shoulder seasons are above normal, while the mid-winter months riding slightly higher than normal.

2015-2016 El Niño Season

The most recent El Niño in 2015-16 produced normal to below-normal snowfall across Montana based on a 10-year average.

Overall, history tells us that most of Montana’s resorts and ski areas tend to be right around average for snowfall during El Niño winters, with the potential for a stronger start and end to the season. Then there’s Red Lodge Mountain which defied past historically high El Nino numbers with a meager 53.5% snowfall in 2015-16. Hopefully that was an outlier season, and we can hope the prior six El Nino winter’s data increase the odds for an above average winter there. But remember that this or any winter outlook will contain a fundamental degree of uncertainty.     

Having said all of this, for skiers and snowboarders, keep in mind that when it comes to finding the best conditions, it’s all about timing. To have the best chance of enjoying the deepest powder, our recommendation is to book a trip 7-10 days in advance.

Sometimes, longer-range forecasts can identify possible storms 1-2 weeks (or longer) in advance, but often, forecast confidence in the details of each storm only begins to increase when the system is about one week away or closer.

Thanks for reading, let’s start doing our snow dances and pre-winter rituals for an off-the charts (++) 2023-24 El Nino winter in the Northern Rockies!

Cheers,

Bob


Below: Possibly a preview of what’s to come at Whitefish?  Image: R. McLaury


Announcements

We're always staying busy behind the scenes building new features and improving upon our existing products to make planning your next adventure even easier.

We can't thank you enough for your direct support of OpenSnow by subscribing to our All-Access subscription. Your support fuels new features and helps us continue to grow our team, including three new engineer hires this year.

Check out our recap of new features that we've released and updates that we've made over the past year.


About Our Forecaster

Bob Ambrose

Forecaster

Ever since his early days as a ski racer on the icy slopes of New Hampshire’s White Mountains, Bob chased his dreams of deep powder west to Tahoe and finally Montana. A self-proclaimed 'weather junkie', his passion for maps, charts, and forecasts always lead him to the best snow in Montana.

Free OpenSnow App