News

By Alan Smith, Meteorologist Posted 1 year ago June 18, 2024
Expert Tips: Tracking Southern California & New Mexico June 2024 Fires
Hot, dry, and windy conditions across the Southwest have contributed to numerous wildfires in mid-June, some of which have experienced rapid growth.
The two most notable fires as of June 18, 2024, are the Post Fire north of Los Angeles and the South Fork Fire west of Roswell, New Mexico. The latter has forced an evacuation of the town of Ruidoso.
As we head into the summer season and wildfire activity picks up, we offer All-Access users numerous tools for tracking wildfires. These tools include wildfire perimeters and hot spots, hourly smoke forecast maps, current air quality, and hourly point weather forecasts for any location.
Active Fires Map
You can track fire incidents in the U.S. and Canada and satellite-detected hot spots globally on our "Active Fires" map. This map updates every hour with new satellite hot spot data. Wildfire perimeters are typically updated about once per day by the National Interagency Fire Center.
To view this map, pull up the "Maps" tab and select the "Active Fires" overlay. Fire incident pop-ups will display as you zoom in, with recent hot spots in the past 2 days denoted by orange and yellow circles.

To view fire perimeter data, zoom in on a specific fire and the most recent perimeter data will display. Note that in the case of recent fires, it can take up to a couple of days for the National Interagency Fire Center to generate a fire perimeter, at which point it will display on our map.
Once you are zoomed in on a fire perimeter, you can click anywhere in the fire perimeter to view more details about the fire, including the following...
- Acreage
- Percent containment
- Time/date discovered
- Time/date of last update
- Fire Cause
- Fire Behavior
- Fuel Sources
The example below is for the Post Fire in Southern California.

View → Active Fires Map
View → Post Fire (CA)
View → South Fork Fire (NM)
Real-Time Air Quality Map
You can use our "Air Quality" Map to see where smoke is impacting air quality. We display the 10-minute average PM 2.5 air quality index from PurpleAir sensors for the past 24 hours with worldwide coverage.
View → Real-Time Air Quality

Smoke and Air Quality Forecast Maps
Our smoke maps use weather model data to project smoke transport out to 2 days. These are excellent resources to determine the likelihood of smoke impacting air quality and breathing conditions in your area.
We provide both high-resolution and medium-resolution smoke maps. The medium-resolution maps cover all of North America and are useful when smoke originates from wildfires in Canada. These maps are displayed as Smoke (surface) and Smoke (smoke) in our maps list.
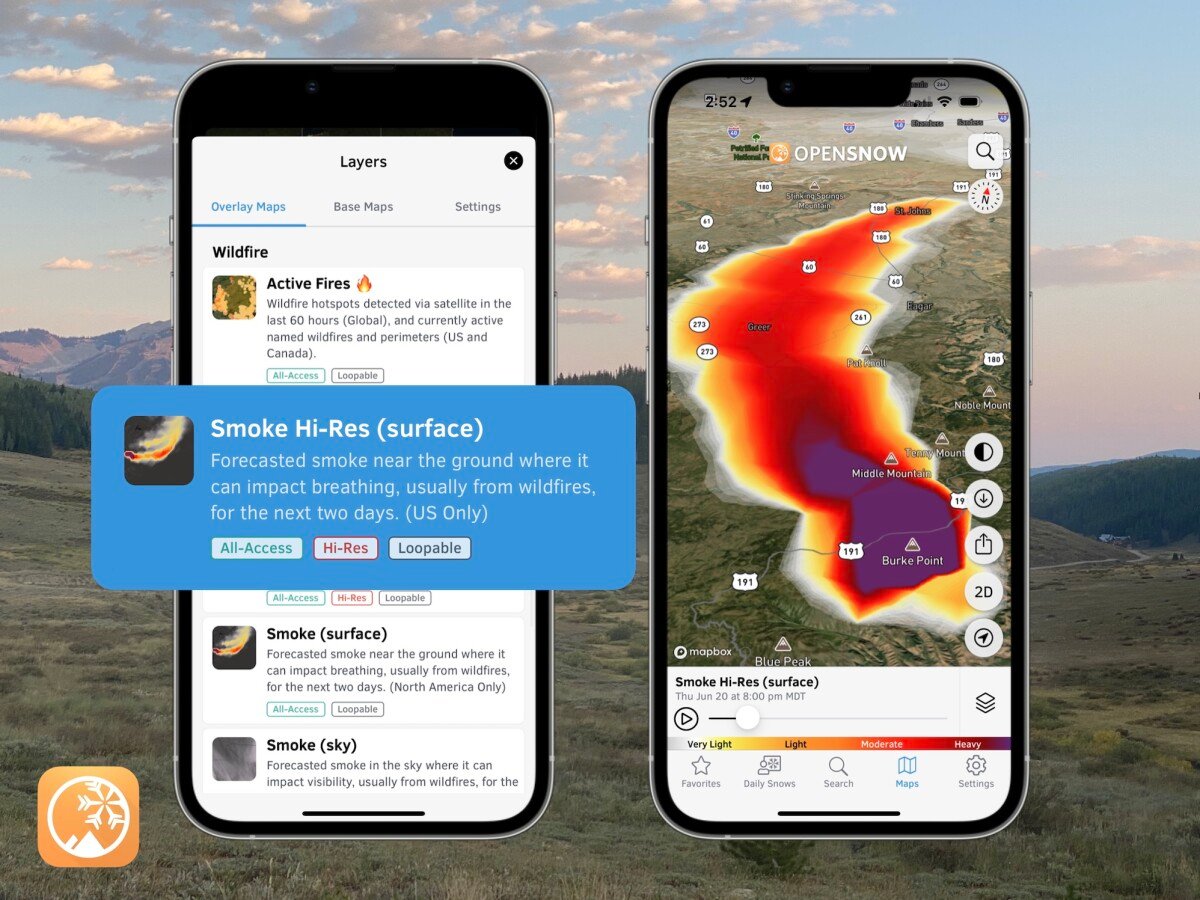
We recommend our high-resolution smoke maps for wildfires that are located within the U.S. These maps are displayed as Smoke High-Res (surface) and Smoke High-Res (sky) in our maps list.
- Our Smoke High-Res (sky) Map displays smoke in the upper levels of the atmosphere, which may impact visibility and lead to hazy conditions but may not necessarily impact air quality and breathing conditions if the smoke remains well above ground level.
- Our Smoke High-Res (surface) Map is most useful for smoke that may impact air quality and breathing conditions.
These smoke maps update every hour as new model data comes in.
View → Smoke Hi-Res (surface) Map

Smoke forecasts are most reliable within the next 48 hours. However, we also offer low-resolution air quality forecast maps based on global weather model data that project air quality out to 5 days. These are useful for getting a general idea of smoke transport in the 2-5 day timeframe.
View → Air Quality Forecast Map
In the example below, the global model we use for the Air Quality Forecast Map is picking up on a wind shift on June 20 that would likely shift the plume of smoke originating from the South Fork fire into Northwest New Mexico toward the Four Corners.

10-Day Hourly Weather Forecast for Any Location
Fire behavior is highly dependent on short-term weather conditions. Hot, dry, and windy conditions fuel wildfires and can lead to rapid spread, whereas cooler and more humid conditions with lighter winds can suppress fire growth and reduce fire behavior.
Our Forecast Anywhere feature allows All-Access users to point and click anywhere on a map to view a weather forecast. You can also enter the name of a town or point of interest in the search bar, or view a weather forecast for your current location.
To get an idea of weather conditions in the vicinity of a wildfire, point and click on a location just outside of the fire perimeter box. Once you have selected a forecast location, make sure the "Weather" tab is selected at the top.

Here are some forecast variables that are useful for anticipating fire behavior and/or the potential for new wildfires.
Temperature
Wildfires are more likely to thrive and grow when temperatures are hot. While temperature thresholds are somewhat elevation-dependent (high-elevation terrain is usually cooler), active fire behavior is more likely when temperatures are in the 80s and 90s.
Around the South Fork Fire, high temperatures will be in the 80s on Tuesday and Wednesday but will cool off significantly on Thursday with highs in the 60s which should aid firefighting efforts.

Relative Humidity
Relative humidity is a function of both temperature and moisture (i.e. water vapor in the atmosphere). Higher temperatures and lower moisture levels result in lower relative humidity values, while lower temperatures and higher moisture levels result in higher relative humidity values.
Wildfires are more likely to thrive when relative humidity is low, and the potential for new fires is also higher when relative humidity is low.
Relative humidity values of 10-20% indicate that conditions are dry enough for active fire behavior and new fire starts. RH values of less than 10% increase the potential for more extreme fire behavior and growth along with a high potential for new fire starts.
Relative humidity is usually lowest in the afternoon when temperatures are warmest, and this explains why fire behavior is often more active during the afternoons and early evenings.
To view humidity forecasts on our app, swipe left over the weather variables until you find "Humidity".
For the South Fork Fire, we are projecting minimum humidity values of 10-15% on Tuesday and Wednesday afternoons. However, humidity values are expected to be much higher on Thursday with minimum values of around 70%, signaling the arrival of moisture in the atmosphere along with cooler temperatures.

Wind Speed and Direction
Wind is arguably the most important factor when it comes to wildfires, as strong winds can lead to rapidly spreading fires. Wind direction is equally important as this dictates the direction a fire will move.
In our hourly forecasts, we display wind direction (the direction the wind is blowing from), sustained wind speed, and wind gusts. For example, a label of "WSW 10 G17" indicates a wind blowing from the west/southwest with sustained winds of 10 mph and wind gusts of up to 17 mph.
Our forecast for Tuesday afternoon (left image) near the South Fork Fire indicates winds that are strong enough to lead to fire spread with a wind direction out of the southwest to west/southwest indicating the fire spread will likely occur to the east and northeast of its current location.
On Wednesday, it's important to note that wind shift is expected to the southeast. This indicates that progress on the eastward movement of the fire should slow down, while fire spread may occur on the northwest side of the fire.

Wind Gust Forecast Map
We also have a wind gust forecast map overlay, which shows projected hourly wind gusts out to 48 hours. This is based on a high-resolution weather model, and may not exactly match our point forecasts. If does give a good "visual" of when stronger winds are expected.
View → Wind Gust Map

View Current Wind (and other Weather Data) on our Weather Stations Map
We also have a map overlay that displays current weather information from actual weather stations. This is great for getting an idea of real-time weather information that could be impacting fire behavior.
To view this data, go to Maps and select the "Weather Stations" map overlay. At the top of the map, there is a menu of weather variables. To view current wind data, tap on "Wind Speed" or "Wind Gust". Note: not all weather stations measure wind, and the availability of data can vary considerably by location.
Here is a look at current wind gusts near the South Fork Fire on Tuesday afternoon.

View → Weather Stations Map
You can also click on any weather station on the map to view more detailed weather data over the previous hours and days.
When you tap on a station, the first window that pops up will display current conditions (left image). To view conditions over the past 24 hours or more, tap on the "Charts" tab to view this data in graphical form (right image). If you prefer to view a list of hourly data, tap on the "Data" tab.

Precipitation
Rain can help to reduce fire activity, and we provide daily and hourly precipitation forecasts to help you anticipate when rain may occur.
Keep in mind that during the summer months, rainfall is often "convective" in nature, meaning it can involve hit-or-miss showers or thunderstorms with highly variable and random rainfall amounts. But our rainfall forecasts still provide a good idea of when measurable rain that could aid in fire suppression is more or less likely.
For example, let's take a look at the precipitation forecast for the South Fork Fire on Thursday (June 20) and Friday (June 21).
- On Thursday (left image), hourly rainfall chances are spotty with a total of 0.07 inches of rain projected. This is a sure sign of hit-or-miss showers or thunderstorms, with a relatively low probability of meaningful rain over the fire itself unless a heavy shower or storm sets up in just the right area.
- On Friday (right image), rainfall chances are higher throughout the day with a total of 0.54 inches of rain projected. This indicates that more widespread rain is likely, which could help out substantially with firefighting efforts if this were to verify.

Questions? Send an email to [email protected] and we'll respond within 24 hours. You can also visit our Support Center to view frequently asked questions and feature guides.
Alan Smith
About The Author