News

By Alan Smith, Meteorologist Posted 1 year ago May 10, 2024
Transition to La Niña, Eastern U.S. Summer 2024 Outlook
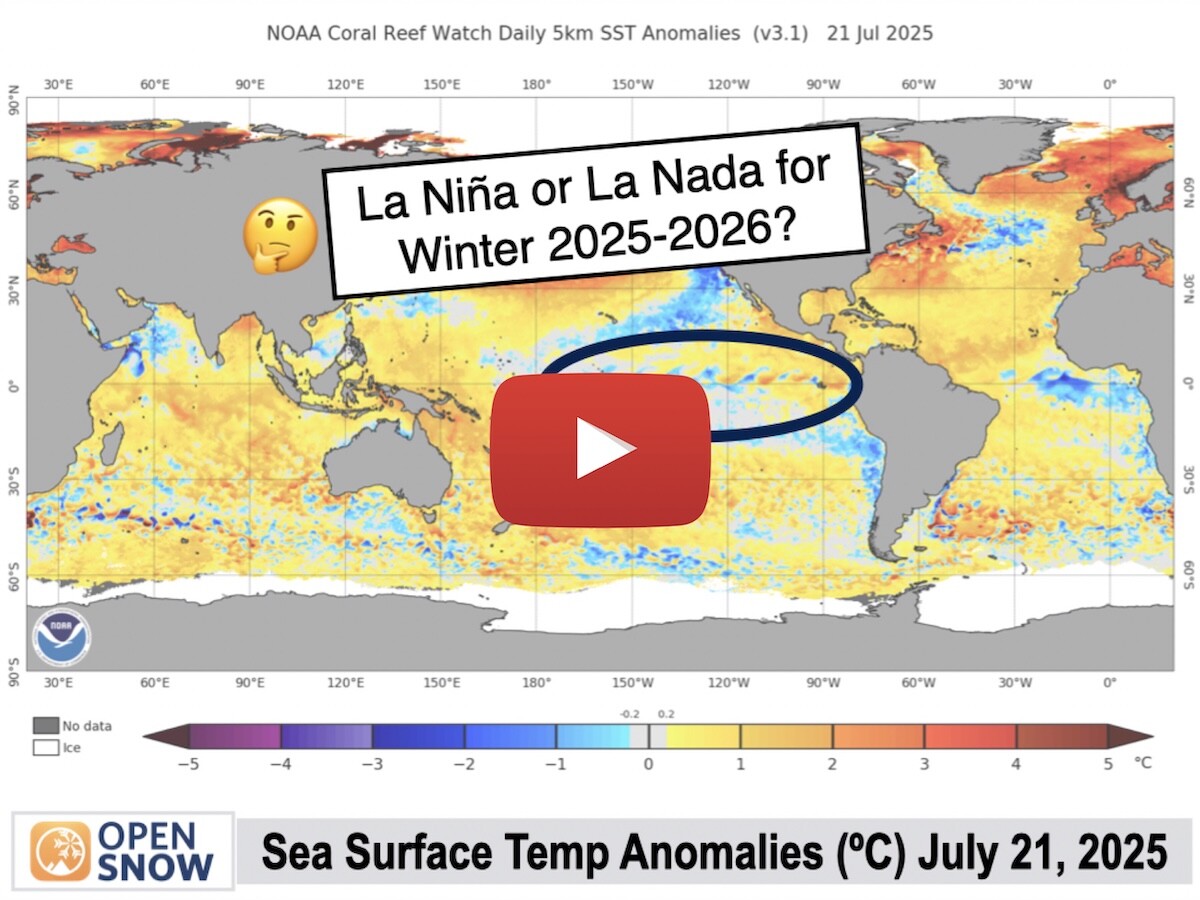
As of early May 2024, El Niño is rapidly weakening due to the cooling of ocean temperatures in the Eastern Equatorial Pacific Ocean, and confidence is increasing that La Niña conditions will develop during the summer of 2024.
From approximately May 2023 through April 2024, El Niño conditions were present as ocean temperatures in the Eastern Equatorial Pacific were warmer than average. However, we are about to reverse course as ocean temperatures in the Eastern Equatorial Pacific have cooled to near average and are expected to become colder than average over the summer.

The transition from El Niño to La Niña conditions is occurring just as we are about to head into the summer season in the Northern Hemisphere.
The graph below shows the probability of La Niña, El Niño, or Neutral conditions for a given 3-month period with each period denoted by the first letter of the month (for example, JJA is denoted for the 3-month average for June, July, and August).

Summer seasonal weather patterns are notoriously difficult to predict in advance, even more so than winter. However, there are some seasonal weather signals that arise across the Eastern U.S. when we examine past summers featuring a transition from El Niño to La Niña.
First, we have identified five analog years since 1991 in which El Niño conditions dissipated in the late winter or spring and La Niña conditions developed during the Northern Hemisphere summer. We then examine each of these summer seasons (June-September) based on 30-year climatological averages from 1991-2020. These analog years include 1995, 1998, 2007, 2010, and 2016.
Given the rate of warming that is occurring in the global climate over the long term, it makes sense to examine more recent years based on 1991-2020 averages rather than diving too deep into the past. New 30-year averages are determined at the start of each decade.
Prevailing Large Scale Patterns
During past El Niño to La Niña transition summers, there is a pronounced signal toward strong and persistent high pressure ridges over the East Central U.S., extending from the Gulf of Mexico north to the Great Lakes and east into the Appalachian Mountains. However, low pressure troughs are more favored for Southeast Canada and Eastern New England.
During the five analog years examined, this pattern is most pronounced late in the summer (August-September) and less so earlier in the summer (June-July).
The map below indicates the departure from normal "heights" in the upper atmosphere at approximately 18,000 feet above sea level from June to September for the five analog years (1995, 1998, 2007, 2010, and 2016).
Positive (+) anomalies indicate higher heights and stronger "ridging" than normal, and negative (-) anomalies indicate lower heights and more "troughing" than normal.

Here are some of the key weather pattern trends we have found during El Niño to La Niña transition summers when examining the four-month period from June through September:
- Temperatures tend to be hotter than average across most of the East and Upper Midwest, except for Northern New England where temperatures tend to be closer to average.
- Late summer tends to be hotter than early summer with the most pronounced signal for above-average warmth in August and September.
- Rainfall tends to be below average for nearly the entire East Coast region, and above average for the Western Great Lakes and parts of the Central U.S.
- Hurricane season tends to be more active than normal in the Atlantic Basin when La Niña conditions are present, which (all other factors equal) puts the Eastern U.S. at a higher risk of seeing impacts from tropical systems.
Let's take a closer look at seasonal and regional trends for the five analog years for the summer season from June through September...
El Nino to La Nina Transition Summers – Temperature
The four-month period from June to September tends to be hotter than average for nearly the entire Eastern and Central U.S., except for Northern New England where temperatures tend to be close to average. This is not entirely surprising given the strong signal for high-pressure ridging over the East Central U.S.

Image: Departure from average temperatures from June through September during the analog summers of 2016, 2010, 2007, 1998, and 1995. Yellow/red areas show hotter than average temperatures, and green areas show cooler than average temperatures.
One interesting signal we did find is that above-average temperature anomalies tend to be most pronounced late in the summer in August and September.
During June and July, above-average temperatures are still favored throughout the Eastern and Central U.S. though the anomalies are fairly modest in many areas.

Image: Departure from average temperatures for June and July during the analog summers of 2016, 2010, 2007, 1998, and 1995. Yellow/red areas show hotter than average temperatures, and green areas show cooler than average temperatures.
However, the above-average temperature signal becomes much stronger in August and September. This indicates a higher likelihood of more severe heat late in the summer compared to early in the summer. Also, summer's heat may be slower to relent than normal in September, at least outside of New England.

Image: Departure from average temperatures for August and September during the analog summers of 2016, 2010, 2007, 1998, and 1995. Yellow/red areas show hotter than average temperatures, and green areas show cooler than average temperatures.
El Nino to La Nina Transition Summers – Precipitation
The high pressure-dominant pattern over the East Central U.S. that is favored during El Niño to La Niña transition summers tends to result in below-average rainfall across nearly the entire Eastern U.S.
However, the Western Great Lakes region is favored for above-average rainfall on the western side of the ridge, and the same is true for the Central Great Plains extending southward into Texas.

Image: Departure from average rainfall for July and August during the analog summers of 2016, 2010, 2007, 1998, and 1995. Green areas show above-average rainfall, and yellow and red areas show below-average rainfall.
Winds aloft blow in a clockwise direction around high pressure ridges. With high pressure ridging favored over the East Central U.S., this means that the favored wind direction across the Great Plains would be out of the south, which in theory would help to transport Gulf of Mexico moisture northward into Minnesota and Wisconsin.
The dominant pattern identified in past El Niño to La Niña transition seasons could potentially favor more frequent severe thunderstorms across the Western Great Lakes region as well.
This is due to the combination of moisture (above-average rainfall signal ) and heating (above-average temperature signal), which are two ingredients that can contribute to severe weather. Mid-summer is when severe thunderstorms are most common across the Northern Plains and Great Lakes when the average position of the jet stream is near the U.S./Canada border.
While the East Coast and Appalachians have a strong dry signal, that doesn't mean there won't be periods with frequent rain and thunderstorms, including occasional strong to severe thunderstorms, as these are typical weather patterns in the summer months. Also, there is the hurricane factor to consider...
Active Atlantic Hurricane Season Expected
There is a strong correlation between El Niño and La Niña and hurricanes in the Atlantic Basin. During El Niño phases, we tend to see fewer hurricanes in the Atlantic due to increased wind shear (changes in wind speed and direction with increasing altitude) which is unfavorable for tropical development.
La Niña has the opposite effect with weaker wind shear in the Atlantic Basin. This favors more tropical storms and hurricanes, resulting in a greater risk of landfalling hurricanes in the Southern and Eastern U.S.

As of spring 2024, ocean temperatures are warmer than average in the Central and Eastern Atlantic Basin, and this is forecast to persist through the summer season. Warm ocean water is "fuel" for tropical storm and hurricane development, and is another factor that could contribute to a busy season.
Researchers at Colorado State University have been producing seasonal hurricane forecasts since 1984 and are well-regarded for their expertise.
Check out CSU's most recent hurricane season forecast that was produced in early April:

More Details → CSU Forecast for 2024 Hurricane Activity
What About Eastern Canada?
Unfortunately, past monthly, annual, and seasonal climate data on a large scale is limited for Canada compared to the U.S.
However, based on the limited data that is readily available, Quebec, New Brunswick, and Nova Soctia appear to be favored for below-average rainfall and near-average temperatures (similar to Northern New England).
Last summer, Nova Scotia experienced significant wildfires, so you may be wondering how this summer looks from a wildfire perspective. Environment Canada is projecting "average" fire potential this summer for Eastern Canada, with above-average fire potential confined to Western Canada.
Limitations of Seasonal Forecasting
While these past signals are fun to examine and offer some insights as to what we might expect this summer, keep in mind that seasonal outlooks should always be taken with a grain of salt. There are many factors in the atmosphere that cannot be anticipated months in advance and every year is unique in its own way.
We will continue to monitor the emerging La Niña as the summer progresses and stay tuned later this summer as we start to dive into winter outlooks for 2024-2025.
Weather Coverage For Every Season
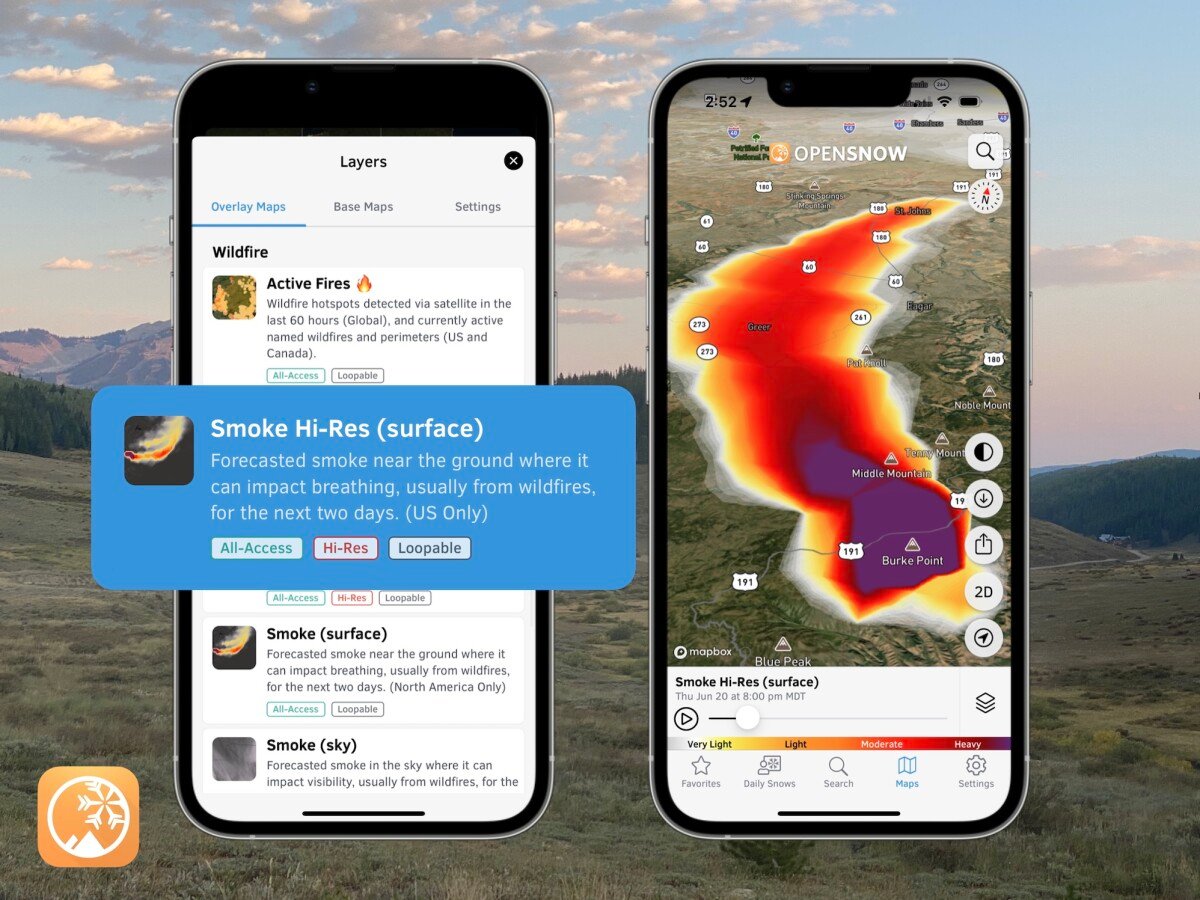
Don’t forget that you can use OpenSnow as your go-to weather app, no matter the season.
Switch to using your "Summer" favorites list, check the "Weather" tab on both the Favorites screen and any location screen, and avoid poor air quality & incoming storms with our summer-focused map layers in the OpenSnow app.
You can also view the hourly forecast for the next 10 days for any location on Earth in OpenSnow:
- Go to the "Maps" tab.
- Tap anywhere or search for a city.
- Tap "View Forecast".
View → Summer Forecasts
Alan Smith
About The Author