South America Daily Snow
By Luke Stone, Forecaster Posted 1 month ago June 18, 2025
A Powdery Opening In the North
Summary
Opening day at Valle Nevado was a powder day, and La Parva and Nevados de Chillan will open today with a lot of recent snow as well. A few more dry days are on the way this week before active weather returns Friday night, with accumulating snow possible, especially in the central zone.
Short Term Forecast
Storm totals in the north ranged from 1 to 2 m during the last storm cycle. With most resorts still closed, reports were unavailable farther south. Nevados de Chillan piled up around 2 m of new snow while Valle Nevado, La Parva, El Colorado, and Farellones clocked around 1.1 m.
Cerroy Bayo opened yesterday (6/17) and several other resorts are opening soon:
- El Colorado: June 19
- Coralco: June 19
- Portillo: June 21
- Las Lenas: June 28
Wednesday through Friday will be dry and calm, but the break won't last too long with the next storm moving in on Friday night. The latest guidance still keeps this storm far enough south that the biggest impacts would be in the central zone.
Another storm is possible early next week, on Monday, that is expected to take a similar track over the southern tip of the continent. The models show a trailing wave behind this upper-level low tracking through the northern zone, but confidence remains low at this time. Below is the upper-level pattern from this Friday through next.

Below is the latest snow forecast from the European model for the first storm, impacting the region from Friday night through Sunday.

Extended Forecast
Nothing stands out regarding storms in the long range at this time, with ridging off the southwestern coast keeping storms mainly to our south.
Next post on Friday.
Thanks for reading the South America Daily Snow!
Luke Stone
Forecaster, OpenSnow
Announcements

NEW: Forecast Range Graphs

You can now view individual forecasts from global and regional high-resolution weather models in OpenSnow. This includes forecasts from the GFS, ECMWF, HRRR, and ICON models, as well as the OpenSnow blend.
The graphs give you a behind-the-scenes look at the forecast and make it easier to see if the forecast models are in tight agreement or if there is a wide range of potential outcomes over the next 10 days.
Note: This is currently only available in the OpenSnow iOS app and website (OpenSnow.com). Android will be available soon.
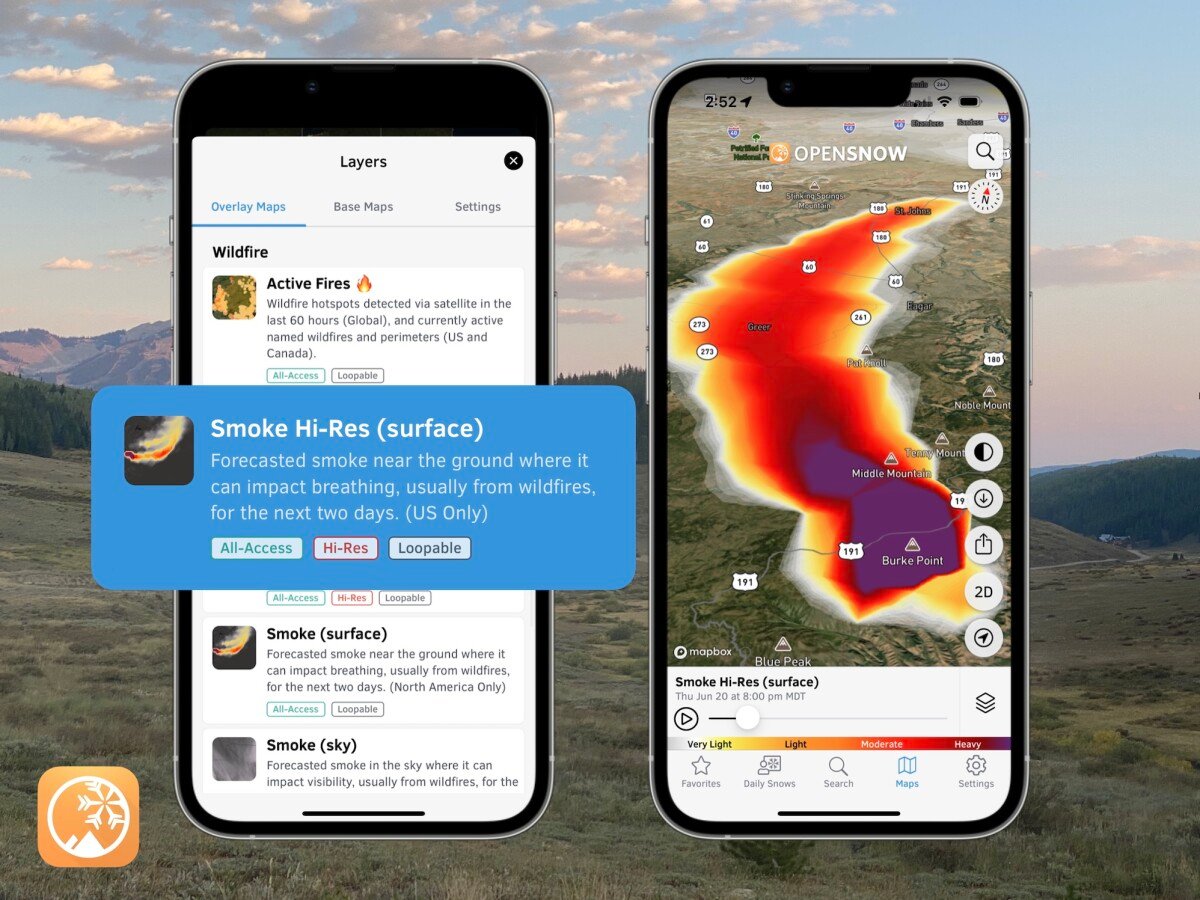
Getting Started
- Go to any location screen.
- Scroll down under "Weather" or "Snow Summary".
- Tap "View Interactive Chart" in the app.
- Adjust the model, timeframe, or data view.

Why is the Forecast Range helpful?
Understand if there is high or low confidence in the forecast. If all models show a similar forecast, there is higher confidence in the forecast, and vice versa.
Dig into the details. If you have experience looking at weather model data and trust certain models or higher-resolution models, you'll be able to isolate your favorite data.
View → Forecast Range Graphs
About Our Forecaster