News

By Julien Ross, Forecaster Posted 9 months ago October 9, 2024
2024-2025 New Mexico Winter Forecast Preview

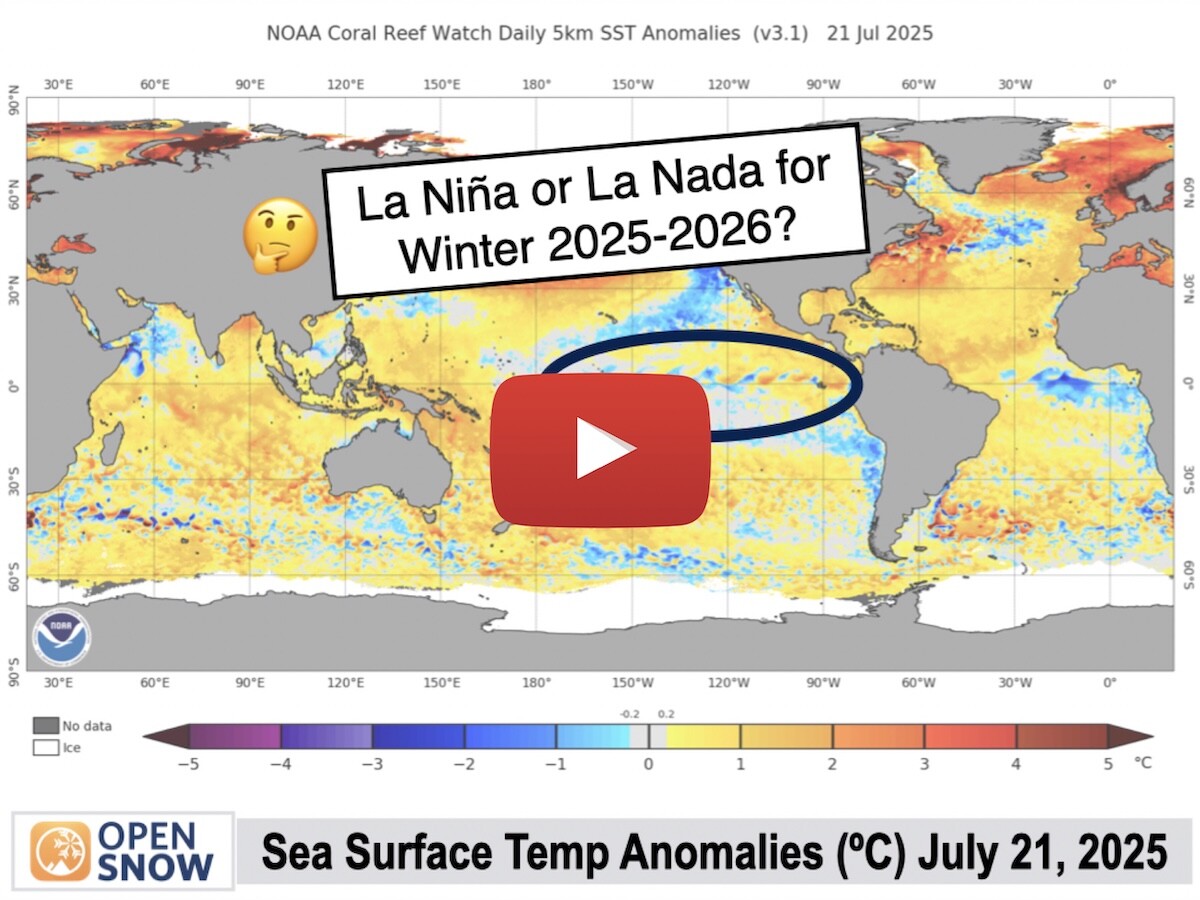
For the upcoming 2024-2025 winter season, weak La Niña conditions are growing and are favored to emerge during the late fall.
Before getting into the details of what that could mean for New Mexico, it's important to remember that any winter outlook will contain an inherent degree of uncertainty.
Long-range forecasts are rarely accurate. These forecasts cover 3-6 months but we know that skiing quality improves and degrades with storm cycles that last a few days to a week.
La Niña, Explained
The term La Niña refers to the large-scale ocean-atmosphere climate phenomenon linked to periodic cooling in sea-surface temperatures across the central and east-central equatorial Pacific.
La Niña represents the cool phase of the ENSO cycle and means that the ocean water temperatures are cooler than average.
La Niña Forecast for the Winter of 2024-2025
"ENSO Neutral" conditions (neither La Niña nor El Niño) have persisted through the summer of 2024. Long-range models have been projecting a higher-than-average chance of La Niña taking over during the winter of 2024-2025.

Image: NOAA Forecast showing the probability of an El Niño, La Niña, and Neutral phase for each three-month period between the summer of 2024 and the spring of 2025. Red bars show the percent chance of an El Niño and the “DJF” label is for “December-January-February”.
The weekly Nino-3.4 region index (sea surface temperatures in the east-central Pacific) anomaly has dropped from 1.8°C during the 2023-2024 winter season to -0.1°C as of September 9, 2024.
Long-range models project this to be a weak La Niña episode with sea surface temperatures ranging from -0.5 to -1.0ºC in the east-central Pacific.
A similar change from El Niño to a weak La Niña last occurred ahead of the 2016-2017 winter season.
Thanks to my OpenSnow colleague Alan Smith, we have identified six winters since 1990 in which weak La Niña conditions were present:
- 2000-2001
- 2005-2006
- 2008-2009
- 2016-2017
- 2017-2018
- 2022-2023
We will use these winter seasons that featured a weak La Niña as “analog” years for this analysis.
A Note About Historical Snowfall Data Sources for New Mexico
We will mostly rely on SNOTEL data to compare past weak La Niña seasons with the 30-year normal. SNOTEL sites near Ski Santa Fe, Red River, Angel Fire, and Pajarito go back far enough for us to compare all six weak La Niña years. The SNOTEL site near Ski Apache goes back to 2002 so we can't count the 2000-2001 season but we have data for the other five weak La Niña seasons.
For these four SNOTEL sites, we can also look at the change in snow water equivalent (SWE) each month during those years and compare them against the 30-year median change in SWE for that month. This will show us any trends in the timing of snowfall in weak La Niña years.
The SNOTEL sites within Taos Ski Valley and near Sipapu only go back to 2010 and 2006 respectively so we don't have sufficient data for the six weak La Niña seasons. However, we have a goldmine of historical data thanks to Taos Ski Valley's Ski Patrol Weather Site which has a compilation of annual snowfall totals going back to 1967, and thanks to Sipapu management which has measured annual snowfall going back to 1996. So we will use these data to examine the six weak La Niña seasons at Taos and Sipapu. Let's jump in!
Historical Weak La Niña Seasons @ Taos Ski Valley

The median annual snowfall at Taos Ski Valley's Poco weather station between 1991 and 2024 is 163 inches. The median annual snowfall for the six most recent weak La Niñas is 186 inches, or 115% compared to the 34-year median.
Snowfall at Taos Ski Valley During Weak La Niña
- 1991-2023: 163" (Median value 1991-2024)
- 2000-2001: 369" (226%)
- 2005-2006: 111" (68%)
- 2008-2009: 145" (89%)
- 2016-2017: 227" (139%)
- 2017-2018: 82.5" (51%)
- 2022-2023: 238" (146%)
Three of six weak La Niña years were above-normal snowfall at Taos Ski Valley (one significantly above normal), one of the six was just below normal, and two seasons were significantly below normal.
Historical Weak La Niña Seasons @ Sipapu

The median annual snowfall measured by Sipapu between 1996 and 2024 is 146 inches. The median annual snowfall for the six most recent weak La Niñas is 138 inches, or 95% compared to the 34-year median.
Snowfall at Sipapu During Weak La Niña
- 1996-2024: 146" (Median value 1996-2024)
- 2000-2001: 130" (89%)
- 2005-2006: 95" (65%)
- 2008-2009: 186" (128%)
- 2016-2017: 147" (101%)
- 2017-2018: 69" (47%)
- 2022-2023: 150" (103%)
Three of six weak La Niña years were at or just above normal snowfall at Sipapu, one of the six was just below normal, and two seasons were significantly below normal.
Historical Weak La Niña Seasons @ Angel Fire

The 30-year median snow water equivalent (SWE) on March 31 at the Tolby SNOTEL station near Angel Fire is 3.8 inches. I've found that the median SWE near Angel Fire during the six weak La Niña years is 3.5 inches on March 31 or 93% compared to the 30-year normal.
SWE on March 31 During Weak La Niña at Angel Fire
- 1991-2020: 6.8" (30-year normal)
- 2000-2001: 8.1" (126%)
- 2005-2006: 1.6" (59%)
- 2008-2009: 3.2" (99%)
- 2016-2017: 3.9" (84%)
- 2017-2018: .3" (4%)
- 2022-2023: 11" (162%)
Two of the six weak La Niña seasons were above normal snow water equivalent (SWE), one was at normal, one was just below normal, and two of the six seasons were significantly below normal.
For timing, when looking at the change in SWE each month during those years and comparing them against the 30-year median change in SWE for that month:
- November: .7" (39%)
- December: 2.5" (123%)
- January: 1.4" (108%)
- February: .7" (37%)
- March: -1.1" (31%)
For Angel Fire, it tends to be the middle winter months of December and January above normal while the shoulder season months are below normal.
Historical Weak La Niña Seasons @ Red River

The 30-year median snow water equivalent (SWE) on March 31 at the Red River Pass SNOTEL station near Red River is 6.8 inches. I've found that the median SWE near Red River during the six weak La Niña years was 6.2 inches on March 31 or 91% compared to the 30-year normal.
SWE on March 31 During Weak La Niña at Red River
- 1991-2020: 6.8" (30-year normal)
- 2000-2001: 8.6" (126%)
- 2005-2006: 4.0" (59%)
- 2008-2009: 6.7" (99%)
- 2016-2017: 5.7" (84%)
- 2017-2018: .3" (4%)
- 2022-2023: 6.8" (100%)
One of the six weak La Niña seasons was above normal snow water equivalent (SWE), two were at normal, one was just below normal, and two of the six seasons were significantly below normal.
For timing, when looking at the change in SWE each month during those years and comparing them against the 30-year median change in SWE for that month:
- November: 1.4" (79%)
- December: 2.2" (108%)
- January: 1.6" (52%)
- February: .95" (475%)
- March: -.45" (75%)
For Red River, December tends to be at or above normal and February above normal, with dips in January and the early and late shoulder season.
Historical Weak La Niña Seasons @ Pajarito

The 30-year median snow water equivalent (SWE) on March 31 at the Quemazon SNOTEL station near Pajarito is 3.8 inches. I've found that the median SWE near Pajarito during the six weak La Niña years is 2.1 inches on March 31 or 55% compared to the 30-year normal.
SWE on March 31 During Weak La Niña at Pajarito
- 1991-2020: 3.8" (30-year normal)
- 2000-2001: 11.2" (295%)
- 2005-2006: 1.1" (29%)
- 2008-2009: 3.1" (82%)
- 2016-2017: 0.2" (5%)
- 2017-2018: 0.0" (0%)
- 2022-2023: 7.8" (200%)
Two of the six weak La Niña seasons were significantly above normal snow water equivalent (SWE), one was just below normal, and three of the six seasons were significantly below normal.
For timing, when looking at the change in SWE each month during those years and comparing them against the 30-year median change in SWE for that month:
- November: 1.0" (77%)
- December: 1.7" (68%)
- January: 1.7" (49%)
- February: 1.6" (-800%)
- March: -1.2" (39%)
For Pajarito, none of the months in weak La Niñas have been above normal compared to the 30-year monthly median change in SWE. November and December have tended to be the closest to normal. January through March have tended to be the most significantly below normal.
Historical Weak La Niña Seasons @ Ski Santa Fe

The 30-year median snow water equivalent (SWE) on March 31 at the Santa Fe SNOTEL station was 13.4 inches. I found that the median SWE at Ski Santa Fe during the six weak La Niña years was 14.2 inches on March 31 or 106% compared to the 30-year normal.
SWE on March 31 During Weak La Niña at Ski Santa Fe
- 1991-2020: 13.4" (30-year normal)
- 2000-2001: 16.1" (120%)
- 2005-2006: 2.7" (20%)
- 2008-2009: 13.6" (101%)
- 2016-2017: 14.8" (110%)
- 2017-2018: 4.3" (32%)
- 2022-2023: 20.1" (150%)
Three of the six weak La Niña seasons were above normal snow water equivalent (SWE), one was near normal, and two of the six seasons were significantly below normal (20% and 32%).
For timing, when looking at the change in SWE each month during those years and comparing them against the 30-year median change in SWE for that month:
- November: 2.3" (110%)
- December: .6" (18%)
- January: 2.5" (100%)
- February: 2.0" (77%)
- March: 1.8" (82%)
For Ski Santa Fe, November and January have tended to be at or above normal with a sharp drop in December, and then just below normal in the shoulder months of February and March.
Historical Weak La Niña Seasons @ Ski Apache

The 20-year median snow water equivalent (SWE) on March 31 at the Sierra Blanca SNOTEL station near Ski Apache was .8 inches. I found that the median SWE near Ski Apache during the five weak La Niña years was .8 inches on March 31, or 100% compared to the 20-year normal.
SWE on March 31 During Weak La Niña near Ski Apache
- 2010-2020: .8" (30-year normal)
- 2000-2001: N/A
- 2005-2006: .2" (25%)
- 2008-2009: 4.7" (587%)
- 2016-2017: .8" (100%)
- 2017-2018: 0.0" (0%)
- 2022-2023: 3.2" (400%)
Two of the five weak La Niña years were significantly above normal snow water equivalent (SWE), one season was normal, and two seasons were significantly below normal for Ski Apache on March 31.
For timing, below is the November through March change during the three most recent significant El Niño episodes and comparing them against the 20-year median change in SWE for that month:
- November: 0.45" (50%)
- December: .35" (11%)
- January: .9" (60%)
- February: 1.1" (65%)
- March: -3.2" (46%)
For Ski Apache, none of the months in weak La Niñas have been above normal compared to the 20-year monthly median change in SWE. January and February have tended to be the closest to normal. Early and late season shoulder months have been the most significantly below normal.
2016-2017 Winter Season
As mentioned above, the Niño-3.4 region index anomaly as of September 9, 2024, is down to -0.1°C, which is similar to where it was ahead of a La Niña event during the summer of 2016. Let's look at how New Mexico fared in the winter season of 2016-2017.
The map below shows the March 31, 2017, basin average snow water equivalent (SWE) anomaly.

During the winter of 2016-2017, snowfall was near to above normal for most of the northern mountains, with the far northern Sangre de Cristos and the San Juan Mountains well above normal. The southern Sangres, Jemez, the central mountains, and the southern mountains were all at or just below normal.
Overall, history tells us that most mountains of New Mexico tend to be near to just below normal for snowfall during weak La Niña years. The far northern mountains and highest elevations have the best chance of being at or above normal during weak La Niñas. The further south and lower in elevation, the greater the likelihood of having a below-normal season.
The weak La Niña winters analyzed above show a high degree of variability, with several seasons being on the extreme ends of high to low snow seasons, especially further south and lower in elevation like Pajarito and Ski Apache. Weak La Niñas tend to be boom or bust years for New Mexico.
Regarding timing, I didn't see any strong signals or patterns. If anything, the middle months of December, January, and February tend to be snowier than the early or late portions of the season.
Having said all of this, for skiers and snowboarders, keep in mind that when it comes to finding the best conditions, it’s all about timing. To have the best chance of enjoying the deepest powder, our recommendation is to dial in your plans 7-10 days in advance.
Sometimes, longer-range forecasts can identify possible storms 1-2 weeks (or longer) in advance, but often, forecast confidence in the details of each storm only begins to increase when the system is about one week away or closer.
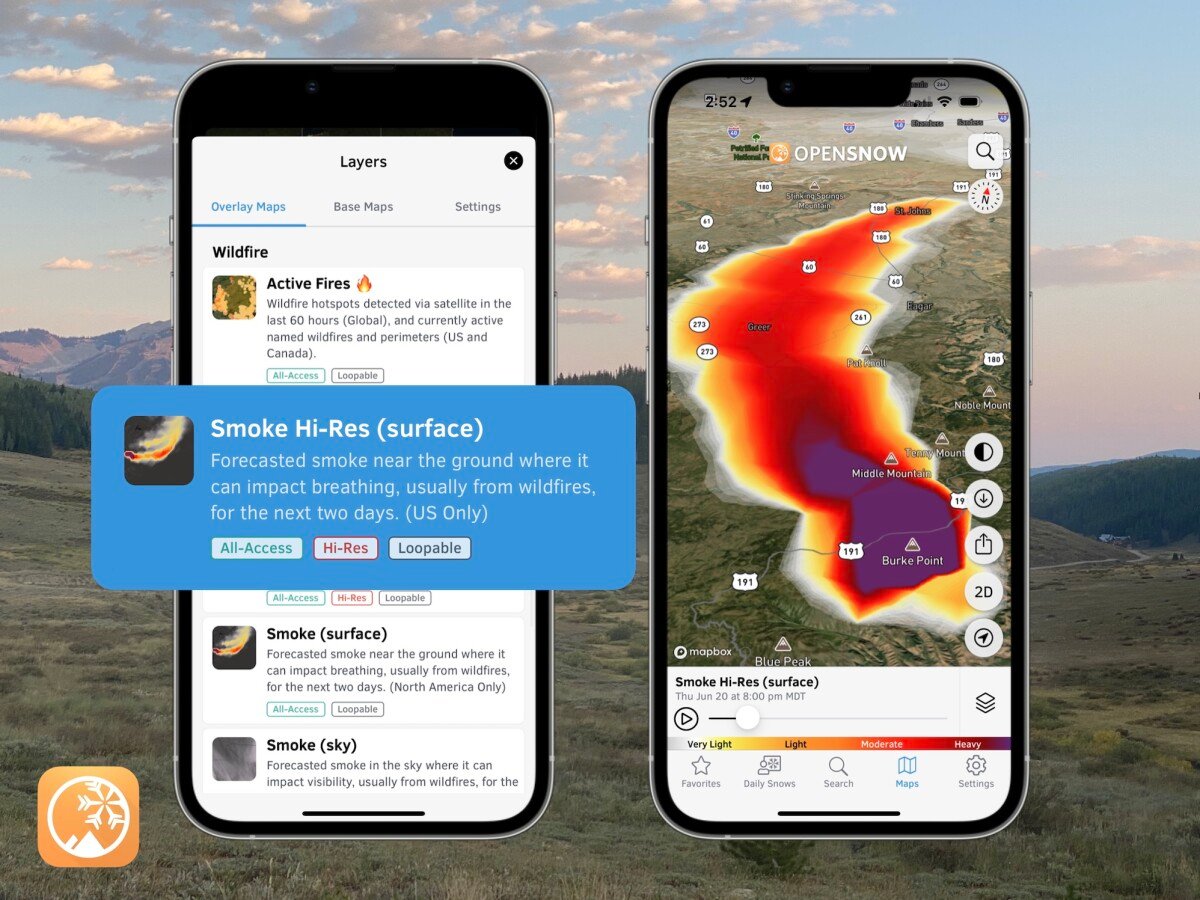
Every OpenSnow All-Access account provides 10-day snow forecasts, expert analysis from local forecasters, 3D weather maps, and custom snow alerts to help you find the deepest snow and the best conditions all winter long.
Thanks for reading! Stay tuned for regular New Mexico Daily Snow updates beginning in November. I look forward to supporting your powder chasing and winter pursuits this season.
¡Viva la Nieve!
Julien Ross
[email protected]
About The Author