News

By Alan Smith, Meteorologist Posted 1 year ago June 29, 2024
2024 Monsoon Season Outlook for the Western U.S.
The North American Monsoon is a seasonal circulation of subtropical moisture that impacts portions of the Western U.S. during the summer months – typically from July to September, but occasionally starting as early as June.
This pattern results in frequent thunderstorms and abundant rainfall across Arizona, New Mexico, Colorado, and Utah, which can be both beneficial for water resources and challenging for outdoor recreation.
Learn More → North American Monsoon, Explained
The strength and duration of the monsoon varies from year to year and is challenging to predict in advance. However, there are some signs that 2024 could be an active monsoon season.
Factors that Can Influence Monsoon Season
Seasonal prediction of the monsoon has always been challenging, but there are several factors that researchers have identified which can offer some clues about whether a monsoon season will be more or less active compared to average.
1) Timing of the Onset of the Monsoon
2) Ocean Temperatures in the Gulf of California
3) El Niño Southern Oscillation
4) Subtropical Ridge of High Pressure
5) Spring Snow Cover in the Southern/Central Rockies
Timing of the Onset of the Monsoon
On average, the monsoon usually starts to ramp up across the Southwest U.S. during early July. Past research has found that there is a connection between the onset of the monsoon and the overall strength of the monsoon.
Earlier starts to monsoon season increase the likelihood of a strong monsoon, whereas later starts to monsoon season increase the likelihood of a weaker monsoon.
For 2024, a monsoon pattern has already taken hold across the Southwest during the month of June with above-average moisture levels (measured by water vapor in the atmosphere) since about the 20th of the month.

Typically, June is a drier month across the Southwest before monsoon season ramps up in July and August. But June rainfall is above-average this month, which is a result of an early start to the monsoon. Based on the early start alone, this increases our odds that this will be an active monsoon season.

Departure from average precipitation during June 2024 (as of June 27). Green colors indicate above-average rainfall, and yellow/orange colors indicate below-average rainfall.
Ocean Temperatures in the Gulf of California
Recent research has found a stronger connection between ocean temperature anomalies in the Gulf of California and monsoon season rainfall west of the Continental Divide.
All other factors equal, above-average ocean temperatures in the Gulf of California can contribute to stronger monsoon moisture surges into Arizona and the Western U.S.
Once the ocean temperature reaches 29ºC in the northern Gulf of California, this increases the likelihood of significant moisture surges that can contribute to heavy rain and flash flooding in the Southwest.
As of June 27, 2024, ocean temperatures are already in the upper end of the 25-30ºC range across most of the Gulf of California.

Ocean temperatures in ºC on June 27, 2024. Temperatures are approaching 30ºC across a large portion of the Gulf of California.
When we compare current sea surface temperatures to average, the Gulf of California is currently warmer than average, which by itself indicates a higher likelihood of an active monsoon season.

Ocean temperature anomalies in ºC on June 27, 2024. Red and orange colors indicate ocean temperatures that are warmer than average, and blue colors indicate ocean temperatures that are colder than average.
One thing that past research has found is that the Gulf of California plays a bigger role in moisture transport west of the Continental Divide, whereas the Gulf of Mexico plays a greater role east of the Continental Divide (including Central New Mexico and the eastern ranges of Colorado).
However, Gulf of Mexico ocean temperature anomalies do not necessarily play a major role in monsoon season rainfall east of the Continental Divide. Since this body of water is located further away from New Mexico and Colorado, wind transport and the location of high and low pressure systems may play more of a role.
El Niño Southern Oscillation
The El Niño-Southern Oscillation (ENSO) refers to the year-to-year variations in sea-surface temperatures, convective rainfall, surface air pressure, and atmospheric circulation that occur across the equatorial Pacific Ocean.
In simple terms, ENSO helps us determine if we are in an El Niño, La Niña, or Neutral phase, and the relative strength of each phase.
Learn More → El Niño and La Niña, Explained
The connection between El Nino, La Nina, and the monsoon is not terribly strong, but past research has found that La Niña tips the odds in favor of a stronger monsoon and El Niño a weaker monsoon.
Currently, we are undergoing a transition from El Nino to La Nina with La Nina conditions expected to officially set in by July or August.
We examined past years dating back to 1990 in which La Nina conditions were present in either July or August (or both). Of these 11 years, we found that above-average rainfall is favored in Arizona, Utah, Western Colorado, and Western New Mexico.
Across Eastern New Mexico, below-average rainfall is favored, while there are no signals across Eastern Colorado. Also, fringe monsoon regions such as the Sierra Nevada Range in California and the Greater Yellowstone Region in Wyoming do not have any above or below-average rainfall signals.

Precipitation departure from average for July and August during past La Nina summers dating back to 1990. Green areas show wetter conditions (more thunderstorms and rain) and yellow/orange colors show drier conditions (fewer thunderstorms and less rain).
Subtropical Ridge of High Pressure
Normally, we associate high pressure with benign weather, but when it comes to the monsoon, the strength and northward progression of the subtropical high pressure ridge that develops each summer plays a vital role in the monsoon.
The subtropical high initially develops over Mexico before gradually migrating northward into the Southern U.S. by the summer.
Winds blow clockwise (anticyclonically) around high pressure centers (indicated by the blue "H"), so once the high pressure center reaches the U.S., winds blowing from the east and south transport subtropical moisture northward into the Southwest U.S.

Stronger-than-normal high pressure centers and earlier-than-normal northward progressions tend to result in earlier and stronger monsoon seasons. Temperatures in the Southwest U.S. during June often correlate well to this pattern. If June is much hotter than average, that is likely a result of stronger-than-usual high pressure and can be a precursor to an active monsoon.
This is exactly what we have seen in June 2024. The average position of the subtropical high has been located further north than usual for this early in the summer, and the Southwest has been much hotter than average this month.
We can look at the departure from average geopotential heights in the upper atmosphere to see this pattern. Above-average heights indicate higher pressure than normal in the upper atmosphere, which is what we have seen in the Western U.S. this month.

The strength and early northward progression of the subtropical high increase the odds of an active monsoon season.
However, the predominant locations of the subtropical high cannot be accurately predicted in advance, and this will also have an impact on monsoon season. Depending on how far west, east, or north the subtropical high fluctuates over the course of the season will influence which areas see more or less rainfall and thunderstorms.
Spring Snow Cover
Interestingly enough, past research has found a connection between spring snow cover in the Southern and Central Rockies and the ensuing monsoon season.
Above-average snow cover in the spring across the Southwest and the Rockies often results in the delayed development and northward migration of the high pressure ridge, which can delay and weaken monsoon season.
This is because a greater amount of solar radiation in the spring is used to melt snow cover rather than heat up the land. But heavy winters followed by warm early springs that lead to early snowmelt can potentially negate the snow cover feedback.
Heading into the spring, snowpack was above-average across the Southern and Central Rockies which seemingly would have tipped the odds in favor of a delayed and weaker monsoon.

Percent of average snowpack by basin as of April 1, 2024
By May 1, snowpack was below average across New Mexico but remained above average across the remainder of the Southern/Central Rockies.
As it turns out, the heavy snowpack did not help to delay the northward progression of the subtropical high into the Western U.S. as June has been much hotter than average.
If we had been looking at monsoon season earlier in the spring, then we may have considered the heavy snowpack more. But it's likely to not be a factor at this point now that the subtropical high, early summer heat, and early onset of monsoon moisture have already been established.
Putting It All Together
Given all of the factors we have examined, the odds favor an active monsoon season with above-average rainfall and thunderstorm activity in Arizona, Utah, Western/Central Colorado, and Western New Mexico.
There are no clear signals toward above or below-average monsoon season rainfall for the eastern ranges of Colorado and New Mexico due to weaker connections with Gulf of California ocean temperatures and La Nina summers.
Fringe monsoon regions such as Wyoming, Idaho, Nevada, and the mountains of California do not have any clear rainfall signals based on La Nina, but in theory, a stronger monsoon would increase the odds of periodic surges of moisture into these areas depending on the interaction between ridges and troughs and resulting wind patterns.
Keep in mind that there is an inherent degree of uncertainty when it comes to monsoon season forecasts. Also, patterns vary over the course of the summer and the most important thing you can do is find a reliable source to track the weather.
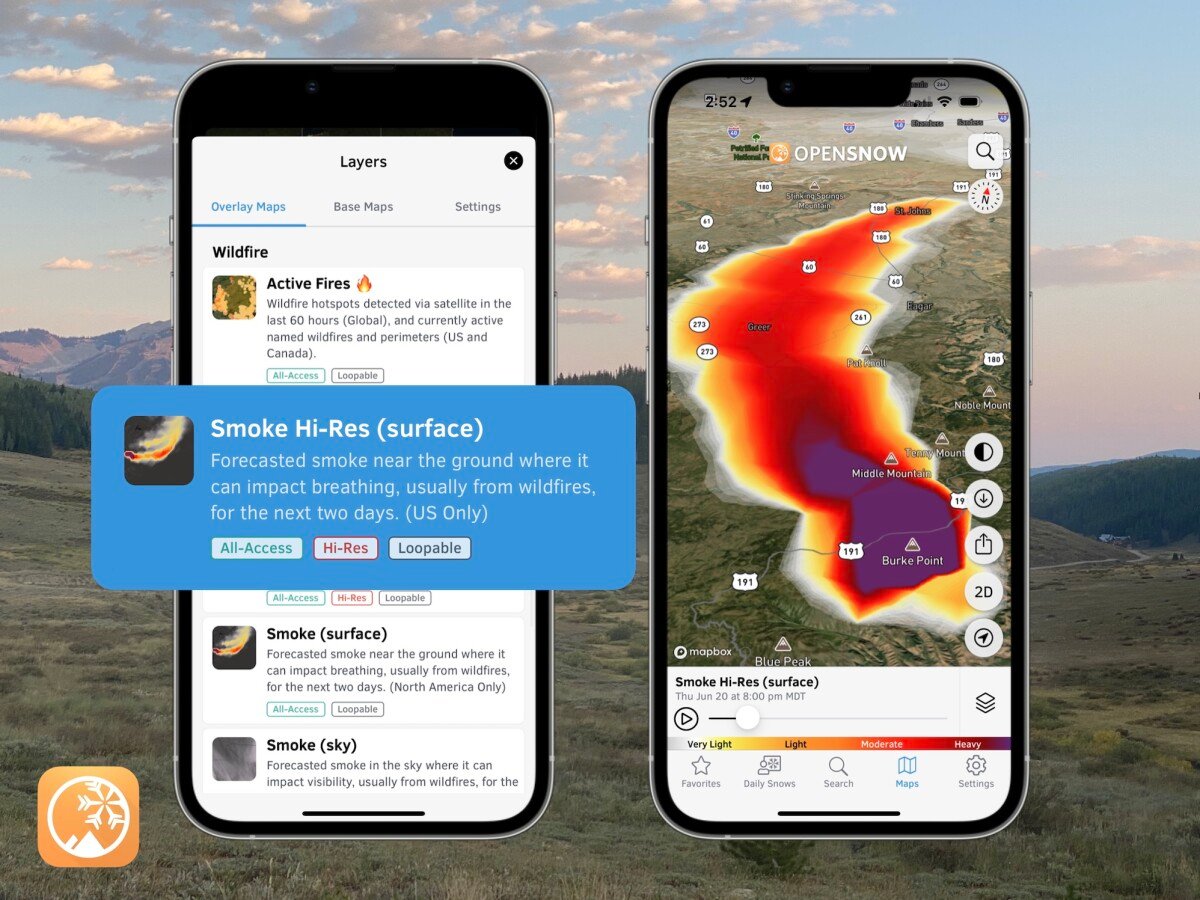
With an OpenSnow All-Access subscription, you can view hourly weather forecasts out to 10 days for any location and elevation in the world under the "Weather" tab, including forecasts for lightning, rainfall, temperature, and more.
Get the forecast for any location (and elevation) in OpenSnow:
- Go to the "Maps" tab.
- Tap anywhere on land.
- Tap "View Forecast" or "Add to Favorites".
Track incoming storms with our high-resolution interactive maps:
Questions? Send an email to [email protected] and we'll respond within 24 hours. You can also visit our Support Center to view frequently asked questions and feature guides.
Alan Smith
About The Author


