News

By Alan Smith, Meteorologist Posted 1 year ago May 24, 2024
How to Plan a Trip to Olympic National Park Around the Weather
Olympic National Park in Washington is a world-class hiking destination known for its diversity. Ecosystems on the Olympic Peninsula range from dramatic coastlines to temperate rain forests to glaciated peaks, with altitudes ranging from sea level to nearly 8,000 feet at the top of Mt. Olympus.
Olympic National Park also has one of the most diverse climates of any region in the United States. In fact, the highest average annual precipitation in the entire United States is found in the western side of the park, supporting massive old-growth forests.

Precipitation Climatology
Average annual precipitation ranges from about 80-100 inches along the Pacific Coast of the Olympic Peninsula. As moisture pushes inland, it is forced to rise with the terrain of the Olympic Mountains due to the orographic effect, and this leads to enhanced precipitation rates.
As a result, the west side of the Olympic Range (including Hoh Rain Forest) receives more than 130 inches of precipitation annually with even higher amounts estimated over the crest of the range.
Most storms arrive from the southwest or west/southwest, so slopes facing these directions see the highest rain (and snow) totals.
The northeast side of the Olympic Peninsula bordering the Strait of Juan de Fuca is in the rain shadow of the Olympics and sees much lighter precipitation as a result. The town of Port Angeles averages 30 inches of precipitation per year, and the town of Sequim only averages 16 inches.

A map of estimated annual precipitation on the Olympic Peninsula. Source: National Park Service/R. Hoffman.
While these precipitation numbers are remarkable, a large portion of Olympic's annual precipitation occurs between October and April. From May through September, precipitation totals drop off substantially. In fact, this region enjoys some of the most pleasant summer weather in the entire country, with relatively cool temperatures and infrequent rainfall.
Let's take a look at the major climate zones of Olympic National Park...
Wet Season (October through April):
Pacific storm systems slam into the Olympic Peninsula with regularity at this time of the year, resulting in frequent heavy rainfall across the lowlands, while the higher terrain (above 4,000 feet especially) receives substantial snowfall.
The three wettest months of the year are November, December, and January. Precipitation amounts and frequency decrease slightly in February and March. April and October are transition months, when storms still produce substantial rainfall, though amounts and frequency are a little bit lower compared to November-March.
While the soils and vegetation are accustomed to handling significant rainfall in this region, occasionally flooding and runoff can occur, especially during strong atmospheric river events.
Dry Season (May through September):
Storms impact the Olympic Peninsula periodically in May and June, but rainfall amounts decrease substantially compared to prior months and dry stretches with sunshine can also occur.
July and August are the two driest months of the year by far, and in some years, this area can go multiple weeks without rain, though occasionally systems manage to sneak in. September can be very pleasant as well, though average rainfall increases slightly as the jet stream begins its southward migration during early fall.
For hiking and other outdoor activities, May and June can be nice across the lower elevations though occasional wet periods should be expected. July through September is prime time for hiking when rainfall is infrequent and snowpack has typically melted off across the higher trails.
Next, let's take a look at the three major climate zones...
Pacific Coast:
The rocky coastline on the Olympic Peninsula is wild and spectacular, offering unique hiking opportunities where the wilderness meets the beach. This region is battered by strong storms and high surf regularly during the winter months, but the Pacific Ocean has a moderating effect on temperatures.
During the winter, average highs are in the upper 40s and average lows are in the upper 30s. Freezing temperatures can occur, but not with regularity. In the summer, average highs are only in the 60s with average lows in the low 50s. Fog and low clouds are common during the morning hours, even in mid-summer, which along with ocean breezes can make it feel very chilly.

Kalaloch averages about 100 inches of rain per year, with slightly lower amounts toward the northern end of the Peninsula. Snowfall is rare on the coast, but it can happen occasionally when modified arctic air arrives from the north (usually once or twice per winter).

Rain Forests and Olympic Mountain Lowlands:
The western lowlands of the Olympic Range are one of the most incredible environments in the United States with annual precipitation of well over 100 inches per year. This climate supports stunning old-growth forests and there are many opportunities for hiking in this area.
The Hoh Rain Forest and Lake Quinault are two of the main access points for exploring the temperature rain forests of the Olympic Peninsula.
The ocean effects on temperature are not quite as pronounced in these inland areas. Temperatures are slightly cooler in the winter with average highs in the mid 40s and summers are slightly warmer with average highs in the low 70s.
While these values are still fairly tame, the interior lowlands can occasionally see heat waves or cold snaps.

Annual rainfall in this region ranges from about 120-150 inches per year, making this the wettest location in the country. However, less than 2 inches of rain falls in July, the driest month of the year.

The northern lowlands of the Olympic Peninsula are spectacular as well, but the old growth forests are not quite as dramatic as this region receives less rainfall as storms lose some of their moisture passing over the Olympic Mountains.
Lake Crescent, for example, averages 58 inches of rain per year which is still a lot of rain, but far less compared to the west side of the Olympic Peninsula.

Olympic Mountain Highlands:
The climate of the Olympic Range changes substantially as you move up in elevation, where a higher percentage of precipitation falls in the form of snow. Snow is uncommon below 2,000 feet, then increases dramatically above 3,500 feet during the winter and spring.
Hurricane Ridge at 5,200 feet is the easiest access point to the high country of the Olympic Range, though the highest peaks of the range (including Mt. Olympus at 7,980 feet) are much more remote. The higher peaks above 7,000 feet are heavily glaciated despite the relatively low altitude compared to peaks such as Mt. Rainier – this speaks to the amount of moisture and snowfall these peaks receive.
There is a snow telemetry site on Hurricane Ridge that measures snow depth and snow water equivalent. Based on the data period from 2000 to 2004, the average peak snow depth (the amount of snow on the ground) is 104 inches with an average peak date of early April. The average melt-out date is around mid-June, but in drier years melt-out can occur in May while in snowier years, melt-out may not occur until well into July.
Believe it or not, there is a small ski area that operates at the top of Hurricane Ridge from Fridays to Sundays from December to March and the road is open on these days during the winter months, weather permitting.
During the winter months, average high temperatures at Hurricane Ridge are in the 30s and average lows are in the 20s. During the summer, average highs are only in the 60s due to its higher altitude.

Hurricane Ridge averages about 75 inches of precipitation per year (rain and liquid-equivalent snow) on the northern end of the Olympic Range. Further south in the heart of the Olympic Range, precipitation and snow totals are heavier.

While Hurricane Ridge is the easiest way to access higher-elevation hiking trails, there are many other remote and mountainous areas that can be accessed starting from lower-elevation trailheads. The beautiful part about the Olympic Range is that you can start out hiking in an old growth rainforest only to end up on a high alpine pass or peak.
Forecasting Tools
There are numerous weather factors to take into account when planning a trip to Olympic National Park, especially if you plan on hiking in the backcountry. We offer point forecasts for any location and elevation in the world to help you plan your trip around the weather.
Tap on the search icon at the bottom of the app or the search bar at the top of the website. From here, you can enter the name of a lake, trailhead, peak, town, etc.

Once the location pops up, tap on the star icon above the header and add it to your Summer Favorites List.

Is the location you entered not showing up in our search results?
Not to worry, as you can view and save custom points forecasts using our Forecast Anywhere feature.
Go to Maps, and then use our interactive map to zoom, point, and tap anywhere on the map you would like a forecast for. The elevation and lat-long of the point will display, and you can also name your custom point and save it to your favorites.

Weather Tab
Once you have the forecast page for a location pulled up, make sure you select the Weather tab as this will display the most relevant information for warm-season trail activities (as opposed to skiing or winter sports).
This view will display the current estimated weather (based on our forecast data) along with 10-day and hourly forecasts for numerous weather variables.

Temperature
Under the 10-Day Forecast, you can quickly view the high and low-temperature forecasts for each day. For hourly forecasts, select the relevant day and then tap on the Temp tab underneath the daily forecast.

Next to Temp, you can tap on "Feels Like" which shows you what the temperature will feel like, based on a formula that accounts for wind speeds in cooler weather and humidity in warmer weather.
Also, we display hourly temperature forecasts out to 2 days in our high-resolution temperature map overlay. This is based on data from NOAA's high-resolution weather model. This gives a good idea of how temperature changes by location, elevation, and time.
View → Temperature Map
Precipitation
Under the 10-Day Forecast, select Precip % to view hourly rain probability for any of the next 10 days. This will give you an idea of what time of day rain is more or less likely.
We also display the forecast rainfall amount for each day underneath the hourly graph. And if trails are expected to be wet or snow-covered based on current or past weather, then we will display this on the forecast page as well.

You can also use our Radar and Forecast Radar map overlays to track rainfall.
Our Radar map shows current radar with the ability to loop back in time over the past 3 hours. While this is a great tool, keep in mind that terrain can interfere with radar beams and as a result, radar is not always representative of reality in complex terrain.
Our Forecast Radar map displays the projected radar over the next 2 days, and this is based on data from NOAA's high-resolution radar.
This is not always perfect in the case of pop-up "random" showers and thunderstorms, but it still gives a good general idea of what to expect in terms of movement and coverage of showers. This product also tends to be more accurate during widespread precipitation events.
View → Current Radar Map
View → Forecast Radar Map
Snowfall & Snow Depth
We denote precipitation type when snow or mixed precipitation is expected. Purple bars are displayed when a rain/snow mix, sleet, or freezing rain is in the forecast, and blue bars are displayed when snow is forecast. Green bars are displayed when rain is forecast.
Forecast snowfall amounts are displayed underneath the hourly precipitation graph, as is forecast liquid-equivalent precipitation (in purple) when mixed precipitation is expected.
You can also view more detailed snow information, such as snowfall amounts and snow levels (the forecast rain/snow line), by tapping on the Snow Summary tab at the top of the screen.

If you are wondering about snow cover on the trail, you can use our estimated snow depth map overlay
View → Snow Depth Map
Wind
Wind is often a factor on the coast and across higher terrain such as Hurricane Ridge. Swipe left on the list of weather variables to find the wind forecast. We display sustained wind speeds with blue bars and wind gusts in red bars. At the top of each bar, we display the wind direction (where the wind will be blowing from), sustained wind speed, and wind gust denoted by "G".

We also have a map overlay for forecast wind gusts for the next 2 days. You can use this overlay to get a good idea of how winds will vary with elevation and over time.
View → Wind Gust Map
Cloud Cover
You can view hourly hourly cloud cover percentage forecasts out to 10 days. Even during the drier summer months, cloud cover is not uncommon along the coast, which can result in chilly conditions.

We also have an hourly cloud cover map overlay, which displays forecast cloud coverage over the next 2 days.
View → Cloud Cover Map
Humidity
We display hourly relative humidity to give you an idea of how much moisture is in the atmosphere. Relative humidity is typically higher in the mornings (when temperatures are cooler) and lower in the afternoons (when temperatures are warmer).

Lightning
Thunderstorms are uncommon in the Olympics due to the cool Pacific Ocean, which has a stabilizing effect on the atmosphere during the summer months. However, under the right conditions, they can happen during the spring and summer. Higher ridges and peaks in the Olympics are vulnerable to lightning in these scenarios.
Swipe left over the weather variables and then tap on the Lightning tab to view hourly lightning forecasts for any given day. This will give you a good idea of the timeframes in which lightning is most likely. Note that even when "Low Chance" is displayed, you should still factor this into planning and decision-making.

Wildfires and Smoke
Wildfires are uncommon in the Olympics but they can happen under the right setup. During the dry season (especially in late summer once vegetation has dried out), if there is a strong offshore wind event with winds blowing from east to west (rather than west to east), this can have a drying effect over the Olympics and increase the threat of rapidly-spreading wildfires.
Smoke from distant wildfires is more likely to be a concern than local wildfires. Fortunately, winds typically blow from west to east off of the Pacific Ocean, which aids in keeping the Olympic Peninsula smoke-free when there are active wildfires across the West.
However, if high pressure is positioned near or just inland from the West Coast of the U.S., this can result in winds blowing from the south or east which can more easily transport smoke into the Olympics.
We have numerous map overlays to help you track wildfire and smoke activity.
- Active Fires – Wildfire hot spots detected via satellite in the last 60 hours, along with currently active named wildfires and perimeters.
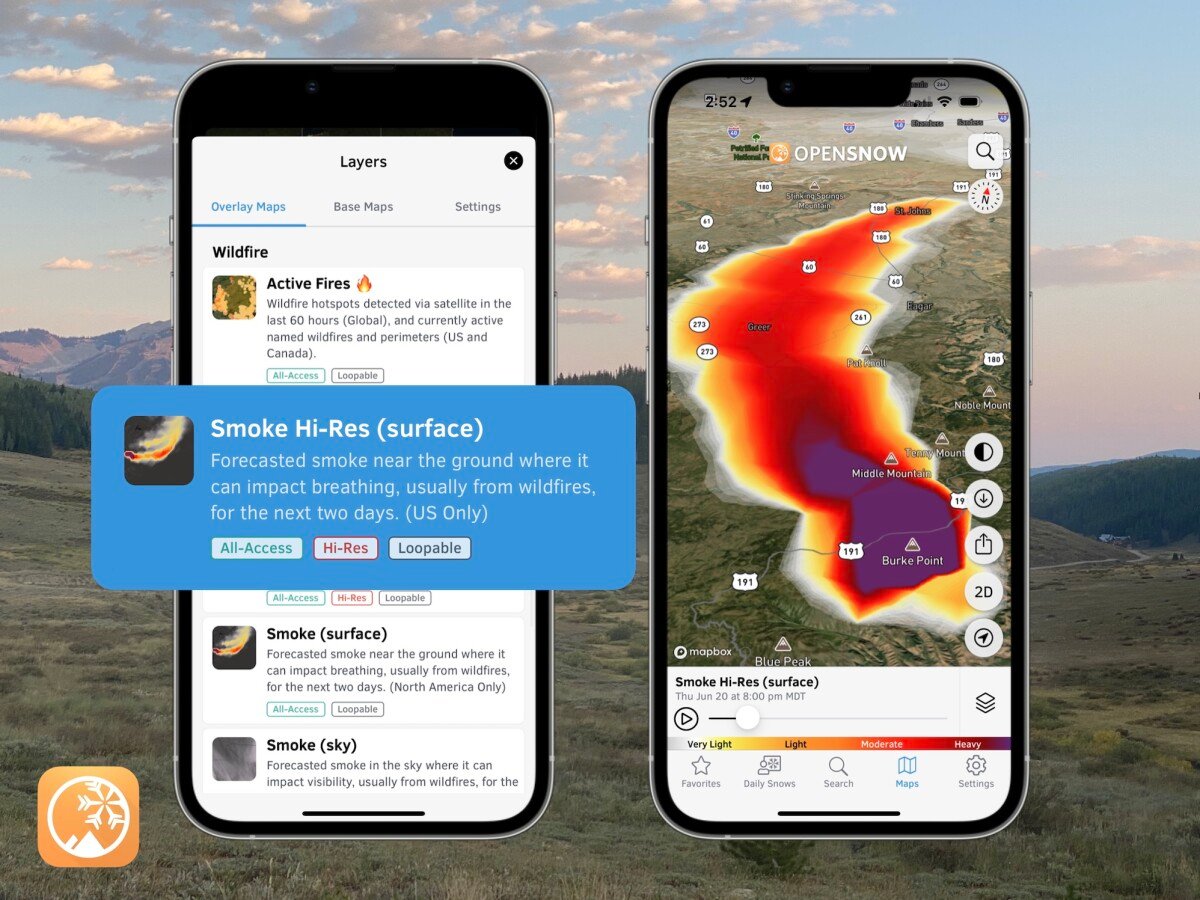
- Smoke High-Res (Surface) – Forecast smoke near the ground where it can impact breathing for the next two days.
- Smoke High-Res (Sky) – Forecast smoke in the sky where it can impact visibility for the next two days.
- Air Quality Real-Time – Current U.S. EPA PM 2.5 Air Quality Index collected from Purple Air sensors. Shown as the 10-minute average for the past 24 hours.
- Air Quality Forecast – A lower-resolution air quality forecast (which includes wildfire smoke) for the next 5 days.
Questions? Send an email to [email protected] and we'll respond within 24 hours. You can also visit our Support Center to view frequently asked questions and feature guides.
Alan Smith
About The Author