News

By Sam Collentine, Meteorologist Posted 10 months ago September 9, 2024
La Niña Emerging, Potential Winter 2024-2025 Impacts

For the upcoming winter season, La Niña conditions are growing and are favored to emerge during the late fall. This article will explain what exactly La Niña is and what a La Niña event could mean for the 2024-2025 ski season.
What is La Niña?
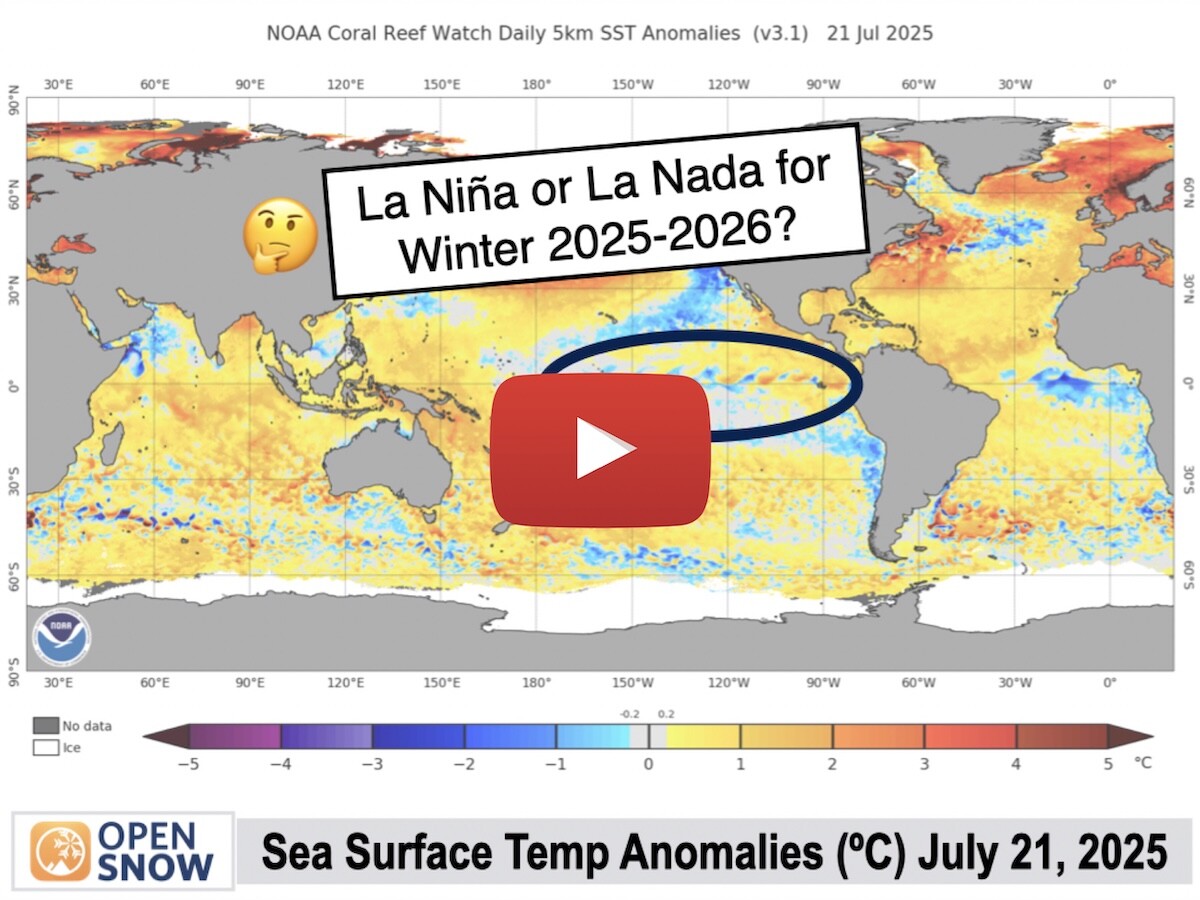
The term La Niña refers to the large-scale ocean-atmosphere climate phenomenon linked to periodic cooling in sea-surface temperatures across the central and east-central equatorial Pacific.
La Niña represents the cool phase of the ENSO cycle and means that the ocean water temperatures are cooler than average.
La Niña Criteria
1) The average sea surface temperatures in the Niño-3.4 region of the equatorial Pacific Ocean were at least 0.5°C (0.9°F) cooler than average in the preceding month.
2) The average anomaly of at least -0.5°C (-0.9°F) has persisted or is expected to persist for five consecutive, overlapping 3-month periods.
Current La Niña Status
Confidence is growing that a La Niña event will emerge for the 2024-2025 winter season.

"ENSO Neutral" conditions (neither La Niña nor El Niño) have persisted through the summer of 2024 and long-range models have been projecting a higher-than-average chance of a La Niña taking over during the winter of 2024-2025.

The weekly Nino-3.4 region index (sea surface temperatures in the east-central Pacific) anomaly has dropped from 1.8°C during the 2023-2024 winter season to -0.1°C as of September 9, 2024.
A similar change from El Niño to La Niña last occurred in 2016.
How predictable are the impacts of La Niña?
There are two major sources of uncertainty in long-range forecasts predicting weather months in advance.
The first source of uncertainty is how accurately we can predict La Niña or El Niño. La Niña is expected to emerge, with chances for La Niña gradually increasing from 66% to 74% during the November 2024 to January 2025 timeframe.
The second source of uncertainty is the atmospheric response to La Niña or El Niño. That is, if La Niña occurs, does it always affect the weather in North America in the same way?
To determine how La Niña impacts weather in North America, we can look at snowfall records during past La Niña events and compare them to a typical year.
Historical La Niña Episodes
The map below shows winter snowfall during seven La Niña episodes. The lower the number, the stronger the La Niña. The blue dots are above average, the white dots are average, and the orange dots are below average snowfall.

The effects of La Nina appear to show much of the Western US receiving average to above-average snowfall during significant events.
Again, though, the pattern doesn’t hold 100% of the time.
2016-2017 Winter Season
As mentioned above, the Niño-3.4 region index anomaly as of September 9, 2024, is down to -0.1°C, which is similar to where it was ahead of a La Niña event during the summer of 2016.
Since this last occurred back in 2016, let's have a little fun by looking back at the snowfall during the 2016-2017 winter season at ski resorts across the Western US.
All data is courtesy of BestSnow.net
- Heavenly: 659" (+159% average)
- Mammoth: 620" (+73% average)
- Alpine Meadows: 552" (+51% average)
- Crested Butte: 350" (+37% average)
- Arapahoe Basin: 349" (+13% average)
- Telluride: 334" (+20% average)
- Alta: 594" (+12% average)
- Snowbasin: 453" (+39% average)
- Park City: 427" (+45% average)
- Mt. Baker: 871" (+35% average)
- Mt. Hood Meadows: 556" (+26% average)
- Mt. Bachelor: 538" (+44% average)
- Jackson Hole: 447" (+21% average)
- Sun Valley: 325" (+68% average)
- Big Sky: 323" (+11% average)
- Stowe: 375" (+28% average)
- Sugarbush: 340" (+32% average)
- Sugarloaf: 213" (+23% average)
- Whitewater: 485" (+33% average)
- Revelstoke: 381" (+5% average)
- Sunshine Village: 303" (+17% average)
- Alyeska: 465" (-27% average)
- Schweitzer: 332" (+22% average)
- Taos: 216" (-14% average)
The 2016-2017 ski season is interesting to look at as a potential comparison for a La Niña episode but keep in mind that no matter how deep or light a winter is overall, when it comes to skiing, it’s all about timing.
Upgrade to OpenSnow All-Access for 10-day snow forecasts, expert local analysis, and custom snow alerts to help you find the deepest snow and the best ski conditions all winter long.

Every OpenSnow All-Access subscription is also good for 365 days.
- 10-Day Snow Forecasts
- Expert Local Forecasters
- Custom Snow Alerts
- 3D Snowfall Maps
- Snow Forecast & Report Widgets
- 10-Day Hourly Forecasts
- Current & Forecast Radar
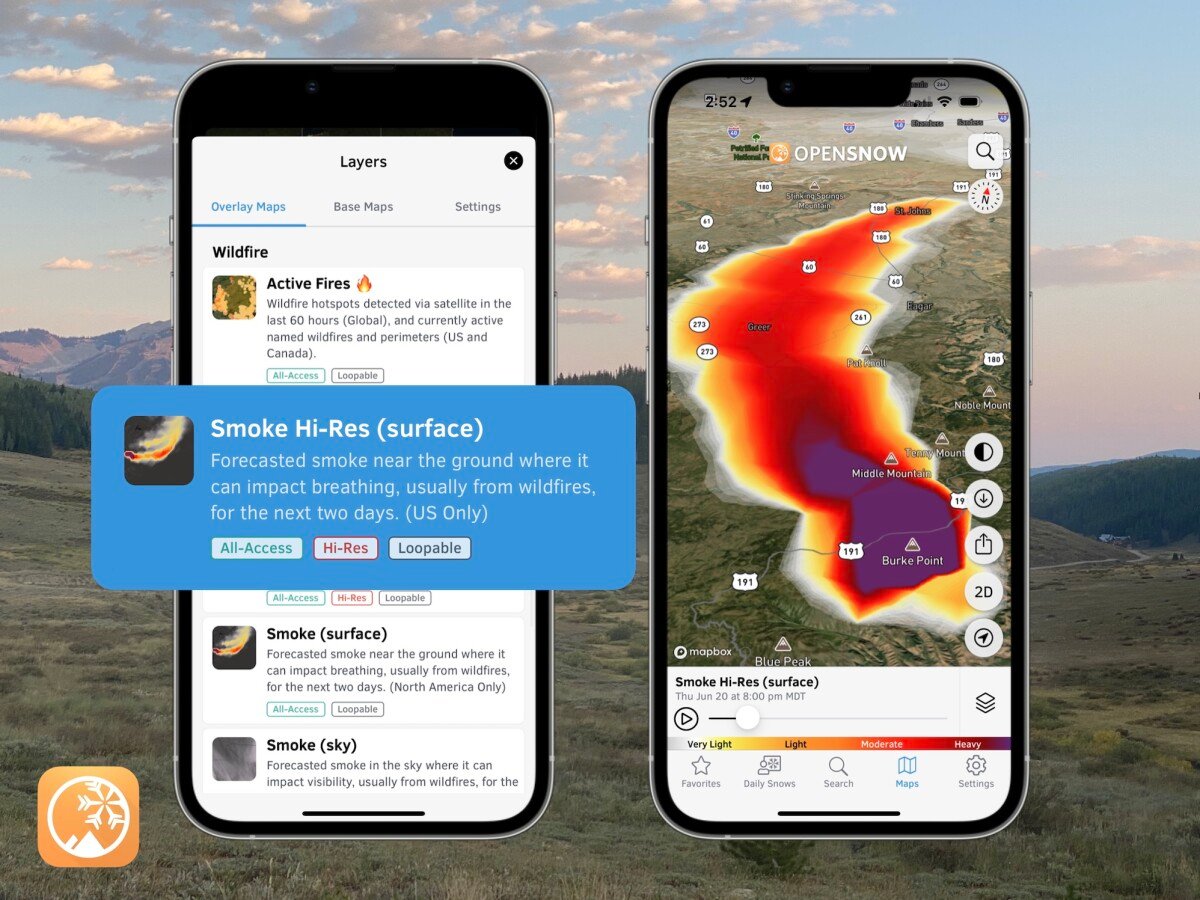
- Active Fire & Smoke Maps
- Lightning Risk Forecasts
- Offline Satellite & Terrain Maps
"OpenSnow is the best resource for planning all outdoor adventures, year-round. The continuing improvements and expansion of offerings make this a first-line choice for people who play outside." – August 2024 Review
Questions? Send an email to [email protected] and we'll respond within 24 hours. You can also visit our Support Center to view frequently asked questions and feature guides.
Sam Collentine
About The Author