News

By Sam Collentine, Meteorologist Posted 1 year ago October 3, 2023
2023-2024 Utah Winter Forecast Preview

The 2022-2023 winter was a record-breaking ski season for Utah. The snowpack trended well above normal from December through April thanks to cold temperatures and consistent storms.
As we look ahead to the 2023-2024 winter season, it's important to remember that any winter outlook will contain an inherent degree of uncertainty. However, there are a few clues that we can keep an eye on thanks to everyone's favorite weather phenomenon: El Niño.
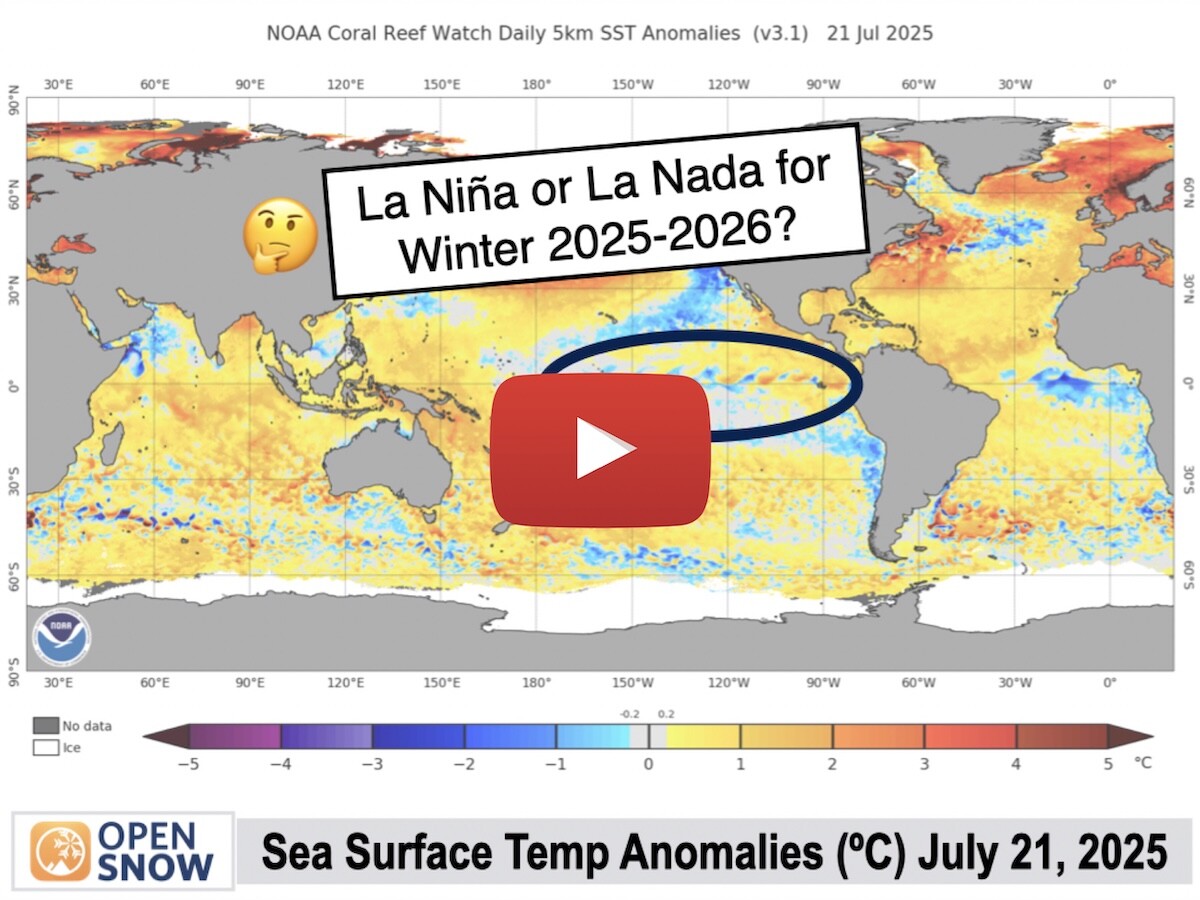
For the upcoming winter season, an El Niño looks to be in store, and better yet, current sea surface temperatures are showing a strengthening El Niño event.
El Niño, Explained
The term El Niño refers to the large-scale ocean-atmosphere climate phenomenon linked to periodic warming in sea-surface temperatures across the central and east-central equatorial Pacific.
El Niño represents the warm phase of the ENSO cycle and means that the ocean water temperatures are warmer than average.
Ski Season Snowfall vs. El Niño
The map below shows winter snowfall during seven significant El Niño episodes across the United States. The higher the number, the stronger the El Niño. The blue dots are above average, the white dots are average, and the orange dots are below average snowfall.

The relationship tends to be a mixed bag for El Niño and snowfall in Utah with most of the state close to average precip and temps during the winter months.
Historical El Niño Seasons @ Beaver Mountain
After looking back at the seven most recent significant El Niño years and comparing them against the 30-year median snow water equivalent (SWE) on March 31 of 35.1 inches at the Tony Grove Lake SNOTEL station near Beaver Mountain, I've found that the median SWE during those El Niño years is 33.1 inches on March 31 or 94% compared to the 30-year normal.
SWE on March 31 During El Niño
- 1991-2020: 35.1" (30-year normal)
- 1982-1983: 36.7"
- 1986-1987: 16.7"
- 1991-1992: 16.9"
- 1997-1998: 41.6"
- 2002-2003: 33.1"
- 2009-2010: 23.9"
- 2015-2016: 37.6"
Three out of the seven El Niño years produced above-normal snow water equivalent (SWE) on March 31, while three out of the seven El Niño years also produced well below-normal SWE.
For timing, when looking at the change in SWE each month during the seven most recent significant El Niño episodes and comparing them against the 30-year median change in SWE for that month...
- October: 0.7" (78%)
- November: 4.7" (85%)
- December: 4.2" (68%)
- January: 5.5" (71%)
- February: 5.3" (62%)
- March: 4.0" (66%)
- April: -7.5" (214%)
It tends to be that most months are below normal.
Historical El Niño Seasons @ Alta/Snowbird
After looking back at the five most recent significant El Niño years and comparing them against the 30-year median snow water equivalent (SWE) on March 31 of 36.3 inches at the Snowbird SNOTEL station near Alta and Snowbird, I've found that the median SWE during those El Niño years is 29.3 inches on March 31 or 80% compared to the 30-year normal.
SWE on March 31 During El Niño
- 1991-2020: 36.3" (30-year normal)
- 1991-1992: 23.0"
- 1997-1998: 36.8"
- 2002-2003: 25.9"
- 2009-2010: 29.3"
- 2015-2016: 33.7"
Only one out of the five El Niño years produced slightly above-normal snow water equivalent (SWE) on March 31.
For timing, when looking at the change in SWE each month during the five most recent significant El Niño episodes and comparing them against the 30-year median change in SWE for that month...
- October: 0.5" (50%)
- November: 2.3" (72%)
- December: 3.6" (63%)
- January: 8.8" (100%)
- February: 5.6" (77%)
- March: 8.3" (93%)
- April: 4.9" (96%)
It tends to be that the beginning of the season is below normal, followed by near-normal months from January through April.
Historical El Niño Seasons @ Brian Head
After looking back at the seven most recent significant El Niño years and comparing them against the 30-year median snow water equivalent (SWE) on March 31 of 13.4 inches at the Castle Valley SNOTEL station near Brian Head, I've found that the median SWE during those El Niño years is 16.5 inches on March 31 or 123% compared to the 30-year normal.
SWE on March 31 During El Niño
- 1991-2020: 13.4" (30-year normal)
- 1982-1983: 27.0"
- 1986-1987: 13.2"
- 1991-1992: 16.6"
- 1997-1998: 16.6"
- 2002-2003: 9.5"
- 2009-2010: 19.5"
- 2015-2016: 15.9"
Five out of the seven El Niño years produced above-normal snow water equivalent (SWE) on March 31.
For timing, when looking at the change in SWE each month during the seven most recent significant El Niño episodes and comparing them against the 30-year median change in SWE for that month...
- October: 0.7" (700%)
- November: 0.8" (53%)
- December: 2.3" (77%)
- January: 2.8" (133%)
- February: 4.1" (100%)
- March: 4.5" (167%)
- April: -9.5" (87%)
It tends to be that the beginning of the season is below normal, followed by near-normal to above-normal months from January through March.
2015-2016 El Niño Season
The most recent El Niño in 2015-16 produced normal to below-normal snowfall across Utah.
- Snowbasin: 277" (91%)
- Alta: 438" (86%)
- Brian Head: 301" (96%)
Overall, history tells us that Utah tends to be right around average to below-average for snowfall during El Niño winters across northern and central Utah, with the potential for above-normal snowfall in southern Utah.
Having said all of this, for skiers and snowboarders, keep in mind that when it comes to finding the best conditions, it’s all about timing. To have the best chance of enjoying the deepest powder, our recommendation is to book a trip 7-10 days in advance.
Sometimes, longer-range forecasts can identify possible storms 1-2 weeks (or longer) in advance, but often, forecast confidence in the details of each storm only begins to increase when the system is about one week away or closer.

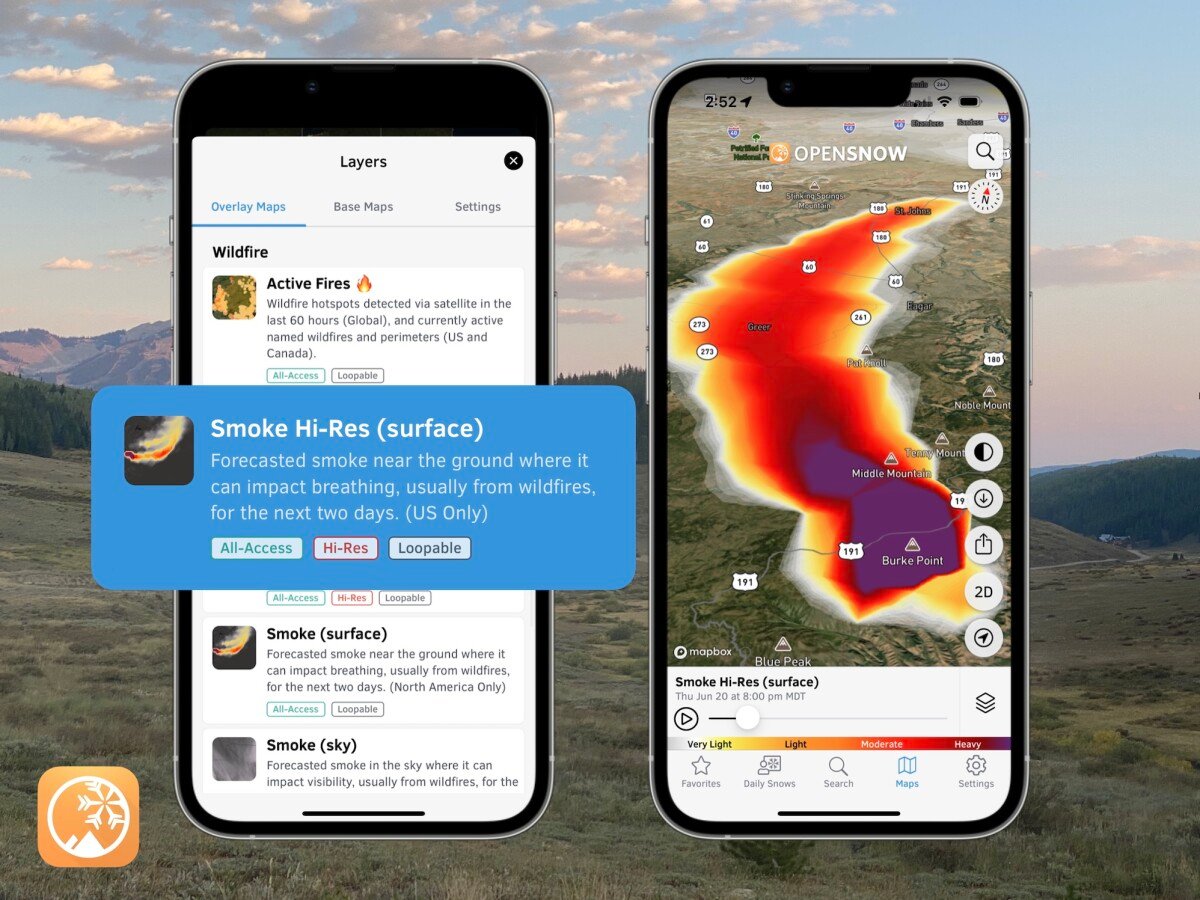
If you're ready to level up your weather app for the upcoming winter season, consider upgrading to OpenSnow All-Access. Whether you’re chasing powder, searching for sunny days, or something in between, our 10-day snow forecasts, expert "Daily Snow" forecasters, and high-resolution weather maps have you covered.
But don't just take my word for it ... "Any weather app can give a mediocre forecast for a mountain town, but only OpenSnow provides a good idea of actual mountain conditions. It's a small price to pay ($29.99/year) for the best weather forecasts." – Real App Review
Sam Collentine
[email protected]
About The Author