News

By Alan Smith, Meteorologist Posted 9 months ago September 30, 2024
2024-2025 British Columbia Winter Forecast Preview

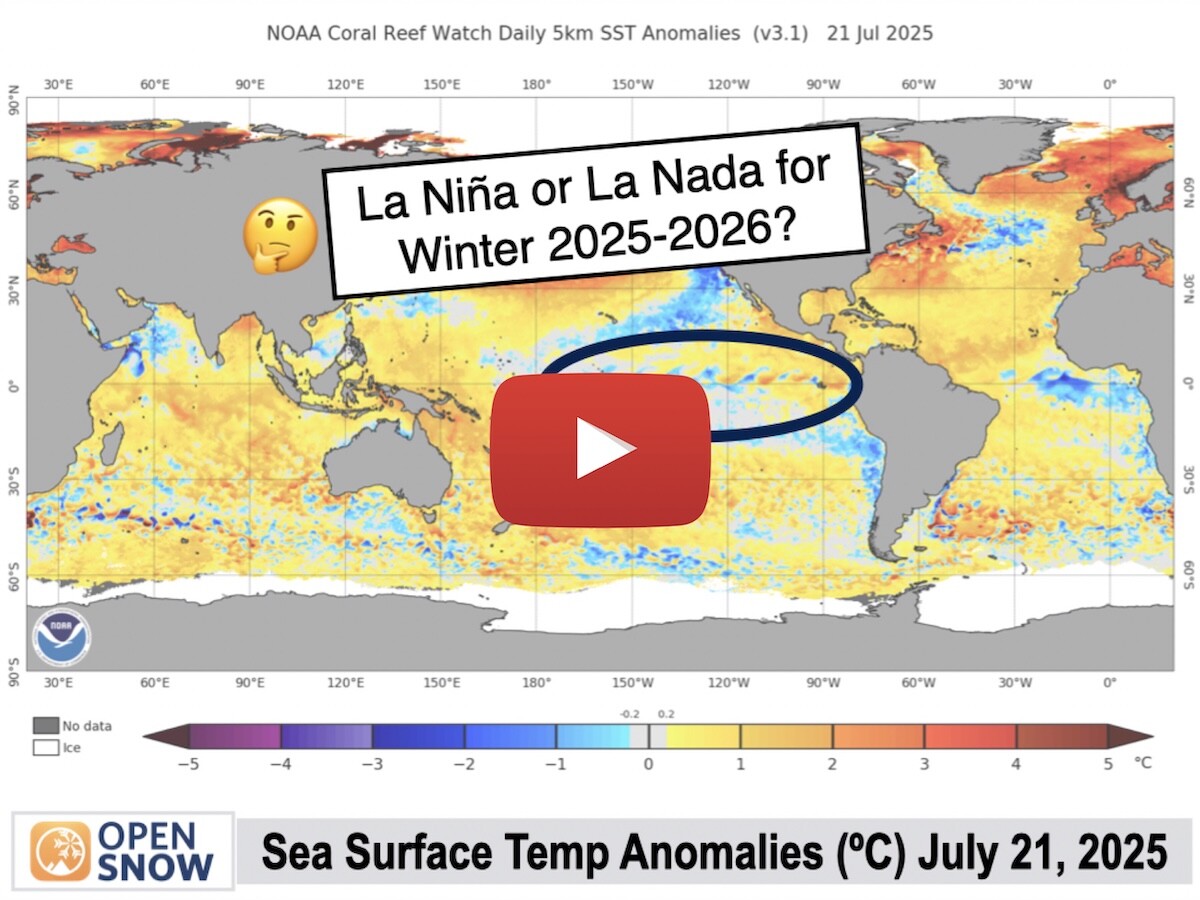
For the upcoming 2024-2025 winter season, La Niña conditions are growing and are favored to emerge during the late fall.
Before getting into the details on what that could mean for British Columbia, it's important to remember that any winter outlook will contain an inherent degree of uncertainty.
Long-range forecasts are rarely accurate. These forecasts cover 3-6 months but we know that skiing quality improves and degrades with storm cycles that last a few days to a week.
La Niña, Explained
The term La Niña refers to the large-scale ocean-atmosphere climate phenomenon linked to periodic cooling in sea-surface temperatures across the central and east-central equatorial Pacific.
La Niña represents the cool phase of the ENSO cycle and means that the ocean water temperatures are cooler than average.
La Niña Forecast for the Winter of 2024-2025
"ENSO Neutral" conditions (neither La Niña nor El Niño) have persisted through the summer of 2024 and long-range models have been projecting a higher-than-average chance of a La Niña taking over during the winter of 2024-2025.

Image: NOAA Forecast showing the probability of an El Niño, La Niña, and Neutral phase for each three-month period between the summer of 2024 and the spring of 2025. Red bars show the percent chance of an El Niño and the “DJF” label is for “December-January-February”.
The weekly Nino-3.4 region index (sea surface temperatures in the east-central Pacific) anomaly has dropped from 1.8°C during the 2023-2024 winter season to -0.1°C as of September 9, 2024.
Long-range models are projecting this to be a weak La Niña episode with sea surface temperatures ranging from -0.5 to -1.0ºC in the east-central Pacific.
A similar change from El Niño to a weak La Niña last occurred ahead of the 2016-2017 winter season.
We have identified six winters since 1990 in which weak La Niña conditions were present:
- 2000-2001
- 2005-2006
- 2008-2009
- 2016-2017
- 2017-2018
- 2022-2023
We will use these winter seasons that featured a weak La Niña as “analog” years for this analysis.
For data sources, we use historical snowfall data at Whistler Blackcomb from the Roundhouse weather station. For all other areas, past snowfall data is limited so we use snow water equivalent data from snow telemetry stations near ski areas.
Some ski areas do not have any snow telemetry sites with long data records nearby, so if you do not see your favorite ski area mentioned, this is likely the reason.
Historical Weak La Niña Seasons @ Whistler Blackcomb

After looking back at the six weak La Niña winters and comparing them against the 30-year median of total snowfall through April 30 of 1012 centimeters (398 inches) for the Roundhouse Lodge at Whistler Blackcomb, I've found that the median snowfall during those years is 904 centimeters (356 inches) or 89% compared to the 30-year normal.
Total Snowfall through April 30 During Weak La Niña:
- 30-Year Normal: 1012 cm
- 2000-2001: 752 cm (74%)
- 2005-2006: 988 cm (98%)
- 2008-2009: 754 cm (75%)
- 2016-2017: 1287 cm (127%)
- 2017-2018: 1152 cm (114%)
- 2022-2023: 820 cm (81%)
Two out of the six weak La Niña years produced well above-normal snowfall, one produced near-normal snowfall, and three produced well below-normal snowfall.
For timing, when looking at the median monthly snowfall during those six weak La Niña winters and comparing them against the 30-year median snowfall for each month:
*Note: Measurements at this station typically do not begin until mid-November.
- November: 77 cm (124%)
- December: 168 cm (74%)
- January: 170 cm (85%)
- February: 143 cm (106%)
- March: 171 cm (88%)
- April: 125 cm (156%)
This gives us a signal that the beginning and end of the season could be above normal, while the core of the season could be near to below normal.
Temperatures at Whistler Blackcomb During Weak La Niña Years:
Temperatures are also a major factor at Whistler Blackcomb, as this impacts snow levels and snow quality. I examined temperature data for the Town of Whistler and found that winter temperatures during the six weak La Nina years are 0.7ºC colder than the 30-year average.
This gives us a signal that snow quality could be better than average for the season as a whole and that snow levels could be a bit lower than average overall.
Historical Weak La Niña Seasons @ Revelstoke

After looking back at the six weak La Niña winters and comparing them against the 30-year median snow water equivalent (SWE) on March 31 of 1185 millimeters (mm) at the Mt. Revelstoke National Park Snow Survey Site near Revelstoke, I've found that the median SWE during those years is 1067 mm on March 31 or 90% compared to the 30-year normal.
SWE on March 31 During La Weak Niña
- 30-Year Normal: 1185 mm
- 2000-2001: 851 mm (72%)
- 2005-2006: 1118 mm (94%)
- 2008-2009: 960 mm (81%)
- 2016-2017: 1183 mm (100%)
- 2017-2018: 1259 mm (106%)
- 2022-2023: 1016 mm (86%)
Three out of the six La Niña years produced near-normal snowfall, and three produced well below-normal snowfall.
For timing, when looking at the change in SWE each month during those years and comparing them against the 30-year median change in SWE for that month:
- November: 167 mm (75%)
- December: 164 mm (75%)
- January: 172 mm (78%)
- February: 180 mm (113%)
- March: 184 mm (94%)
This gives us a signal that the early part of the season from November to January (typically the snowiest time of year) could be below normal, while the later season months of February and March could be near to above normal.
Temperatures at Revelstoke During Weak La Niña:
Temperatures are an important consideration for snow quality and snow levels given the high vertical relief at this resort. I examined temperature data for the Town of Revelstoke and found that winter temperatures during the six weak La Nina years are 0.9ºC colder than the 30-year average.
This gives us a signal that snow quality could be better than average for the season as a whole and that snow levels could be a bit lower than average overall.
Historical Weak La Niña Seasons @ Fernie

After looking back at the six weak La Niña winters and comparing them against the 30-year median snow water equivalent (SWE) on March 31 of 677 1185 millimeters (mm) at the Morrissey Ridge Snow Survey Site near Fernie, I've found that the median SWE during those years is 646 mm on March 31 or 95% compared to the 30-year normal.
SWE on March 31 During La Weak Niña
- 30-Year Normal: 677 mm
- 2000-2001: 360 mm (53%)
- 2005-2006: 750 mm (111%)
- 2008-2009: 608 mm (90%)
- 2016-2017: 690 mm (102%)
- 2017-2018: 683 mm (101%)
- 2022-2023: 436 mm (64%)
One out of the six La Niña years produced well above-normal snowfall, three produced near-normal snowfall, and two produced well below-normal snowfall.
For timing, when looking at the change in SWE each month during those years and comparing them against the 30-year median change in SWE for that month:
- November: 79 mm (77%)
- December: 109 mm (87%)
- January: 89 mm (56%)
- February: 96 mm (97%)
- March: 135 mm (109%)
This gives us a signal that the early part of the season from November to January (typically the snowiest time of year) could be below normal, while the later season months of February and March could be near to above normal.
Temperatures at Fernie During Weak La Niña:
Temperatures are an important consideration for snow quality and snow levels as rain occasionally makes an appearance at Fernie in the winter. I examined temperature data for the Town of Fernie and found that winter temperatures during the six weak La Nina years are 0.8ºC colder than the 30-year average.
This gives us a signal that snow quality could be better than average for the season as a whole and that there may be fewer rain events than usual.
Historical Weak La Niña Seasons @ Red Mountain, Whitewater, and Big White:

After looking back at the six weak La Niña winters and comparing them against the 27-year median snow water equivalent (SWE) on March 31 of 491 1185 millimeters (mm) at the Grano Creek Snow Survey Site in the West Kootenay Region, I've found that the median SWE during those years is 553 mm on March 31 or 113% compared to the 27-year normal.
SWE on March 31 During La Weak Niña
- 27-Year Normal: 491 mm
- 2000-2001: 334 mm (68%)
- 2005-2006: 633 mm (129%)
- 2008-2009: 386 mm (79%)
- 2016-2017: 472 mm (96%)
- 2017-2018: 709 mm (144%)
- 2022-2023: 695 mm (142%)
Three out of the six La Niña years produced well above-normal snowfall, one produced near-normal snowfall, and two produced well below-normal snowfall.
For timing, when looking at the change in SWE each month during those years and comparing them against the 27-year median change in SWE for that month:
- November: 76 mm (97%)
- December: 84 mm (83%)
- January: 111 mm (107%)
- February: 101 mm (117%)
- March: 130 mm (116%)
This gives us a signal that the early season (November-December) could be below normal, while mid to late season (January to March) could be above normal.
Historical Weak La Niña Seasons @ Mt. Washington:

After looking back at the six weak La Niña winters and comparing them against the 30-year median snow water equivalent (SWE) on March 31 of 1249 1185 millimeters (mm) at the Wolf River Upper Snow Survey Site near Mt. Washington on Vancouver Island, I've found that the median SWE during those years is 1048 mm on March 31 or 84% compared to the 30-year normal.
SWE on March 31 During La Weak Niña
- 30-Year Normal: 1249 mm
- 2000-2001: 947 mm (76%)
- 2005-2006: 1652 mm (136%)
- 2008-2009: 850 mm (68%)
- 2016-2017: 1149 mm (92%)
- 2017-2018: 1202 mm (96%)
- 2022-2023: 908 mm (73%)
One out of the six La Niña years produced well above-normal snowfall, two produced near-normal snowfall, and three produced well below-normal snowfall.
For timing, when looking at the change in SWE each month during those years and comparing them against the 30-year median change in SWE for that month:
- November: 151 mm (90%)
- December: 168 mm (52%)
- January: 233 mm (93%)
- February: 157 mm (84%)
- March: 270 mm (110%)
This gives us a signal that early to mid-season could be below normal, while late season (March) could be above normal.
Historical Weak La Niña Seasons @ Shames Mountain (Northwest BC)
After looking back at the six weak La Niña winters and comparing them against the 30-year median snow water equivalent (SWE) on March 31 of 1202 1185 millimeters (mm) at the Tahtsa Lake Snow Survey Site near Shames Mountain in Northwest BC, I've found that the median SWE during those years is 1153 mm on March 31 or 96% compared to the 30-year normal.
SWE on March 31 During La Weak Niña
- 30-Year Normal: 1202 mm
- 2000-2001: 1103 mm (92%)
- 2005-2006: 1113 mm (93%)
- 2008-2009: 1152 mm (96%)
- 2016-2017: 1327 mm (110%)
- 2017-2018: 1213 mm (101%)
- 2022-2023: 1153 mm (96%)
All six of the weak La Nina years produced snowfall within 10% of normal, indicating relatively little year-to-year variability.
For timing, when looking at the change in SWE each month during those years and comparing them against the 30-year median change in SWE for that month:
- November: 285 mm (117%)
- December: 175 mm (65%)
- January: 268 mm (104%)
- February: 140 mm (77%)
- March: 130 mm (71%)
While year-to-year differences are small, snowfall tends to vary widely month-to-month in weak La Nina years with heavier snowfall favored in November and January.
Historical Weak La Niña Seasons @ Cariboo Mountains
After looking back at the six weak La Niña winters and comparing them against the 30-year median snow water equivalent (SWE) on March 31 of 859 1185 millimeters (mm) at the Kostal Lake Survey Site in the Cariboo Range, I've found that the median SWE during those years is 807 mm on March 31 or 94% compared to the 30-year normal.
SWE on March 31 During La Weak Niña
- 30-Year Normal: 859 mm
- 2000-2001: 635 mm (74%)
- 2005-2006: 770 mm (90%)
- 2008-2009: 845 mm (98%)
- 2016-2017: 844 mm (98%)
- 2017-2018: 864 mm (101%)
- 2022-2023: 637 mm (74%)
Four of the six weak La Nina years produced near-normal snowfall and two produced well below-normal snowfall.
For timing, when looking at the change in SWE each month during those years and comparing them against the 30-year median change in SWE for that month:
- November: 113 mm (66%)
- December: 151 mm (85%)
- January: 150 mm (85%)
- February: 94 mm (94%)
- March: 142 mm (102%)
This gives us a signal that the early part of the season from November to January (typically the snowiest time of year) could be below normal, while the later season months of February and March could be near normal.
2016-2017 Winter Season
As mentioned above, the Niño-3.4 region index anomaly as of September 9, 2024, is down to -0.1°C, which is similar to where it was ahead of a La Niña event during the summer of 2016.
During the winter of 2016-2017, snowfall was near to above normal for most of Southern BC (where most ski resorts are located), and below normal across Northern BC.
The map below shows the April 1, 2017 basin average snow water equivalent (SWE) anomaly.

Overall, history tells us that most regions of BC tend to be slightly below normal for snowfall during weak La Niña years with the potential for a stronger finish to the season. However, temperatures tend to be colder than normal during weak La Niña years, possibly resulting in lower average snow levels and better quality snow compared to other years.
Having said all of this, for skiers and snowboarders, keep in mind that when it comes to finding the best conditions, it’s all about timing. To have the best chance of enjoying the deepest powder, our recommendation is to dial in your plans 7-10 days in advance.
Sometimes, longer-range forecasts can identify possible storms 1-2 weeks (or longer) in advance, but often, forecast confidence in the details of each storm only begins to increase when the system is about one week away or closer.
Upgrade to OpenSnow All-Access for 10-day snow forecasts, expert local analysis, and custom snow alerts to help you find the deepest snow and the best ski conditions all winter long.

Every OpenSnow All-Access subscription is also good for 365 days.
- 10-Day Snow Forecasts
- Expert Local Forecasters
- Custom Snow Alerts
- 3D Snowfall Maps
- Snow Forecast & Report Widgets
- 10-Day Hourly Forecasts
- Current & Forecast Radar
- Active Fire & Smoke Maps
- Lightning Risk Forecasts
- Offline Satellite & Terrain Maps
"The OpenSnow app is an absolute must-have for anyone who loves winter sports or simply wants to stay informed about snow conditions. The interface is user-friendly, making it easy to access detailed weather forecasts, snow reports, and mountain updates. The accuracy of the predictions is impressive, giving me confidence in planning my ski trips." – August 2024 Review
Questions? Send an email to [email protected] and we'll respond within 24 hours. You can also visit our Support Center to view frequently asked questions and feature guides.
Alan Smith
About The Author