News

By Joel Gratz, Founding Meteorologist Posted 9 years ago August 16, 2015
El Nino Part 1: What is El Nino and as skiers, why do we care?
We’ll start this three-part series by covering the basics of El Nino and why an ocean can impact snowfall patterns.
What is El Nino?
It is the name given to a period of time when ocean water temperatures in the central Pacific Ocean become warmer than normal.
Where are these ocean temperatures measured?
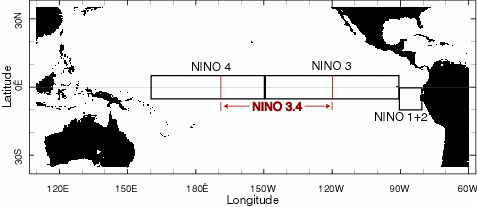
West of South America and east of Australia. There are four regions that scientists use to calculate ocean temperatures. The most commonly cited temperature is from the Nino 3.4 region, which is a combination of Regions 3 and 4.

Source: https://www.ncdc.noaa.gov/teleconnections/enso/enso-tech.php
Are there different strengths of El Nino?
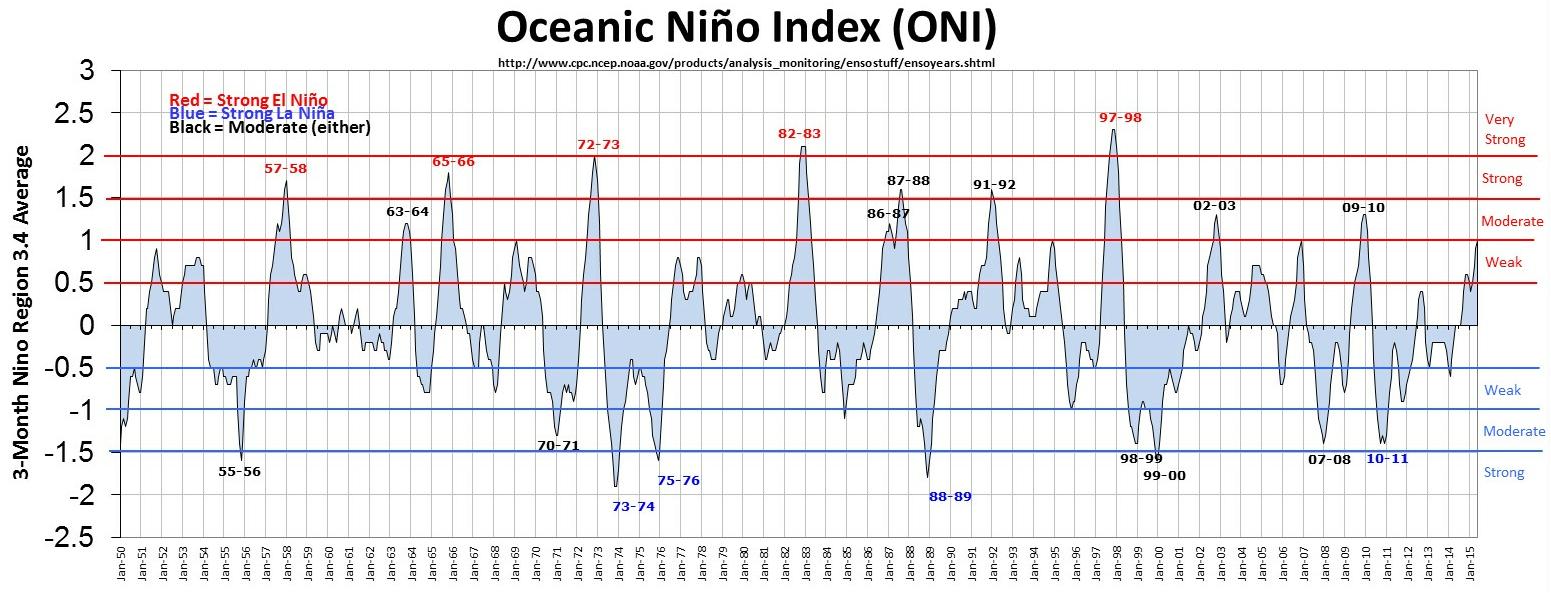
Yes. Ocean water temperatures must reach at least 0.5C above normal (about 1F) during at least half a year to be classified as an El Nino. Ocean temperatures 0.5-0.9C above normal are considered a weak El Nino, 1.0-1.4C is a moderate El Nino, 1.5-1.9C is a strong El Nino, and 2.0C or greater is a very strong El Nino. Since 1950, there have only been two very strong El Ninos. One during 1982-1983 and another in 1997-1998.

Source: http://ggweather.com/enso/oni.htm
Why do we care about El Nino?
What happens in one part of the world does not stay in that part of the world, at least in terms of weather. Everything is connected. When a large area of ocean water becomes warmer than average, it changes where thunderstorms form over the Pacific Ocean, and incredibly, this change in the location of ocean thunderstorms changes weather patterns across the globe.
Are winter weather patterns during El Nino predictable?
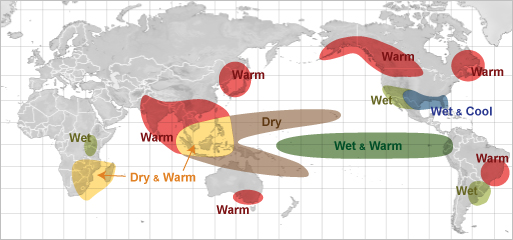
Somewhat. We can look back at past El Nino events and see how they have influenced global weather. No two El Ninos are exactly alike, so the affects on our weather won’t be identical from one El Nino to the next, but there are patterns. Here is El Nino’s typical effect during the Northern Hemisphere winter:

Source: http://www.srh.noaa.gov/jetstream/tropics/enso_impacts.htm
What does this mean for snowfall?
That’s the big question! The map above gives you a general idea of where to find the areas with higher than average precipitation, but as I said, each El Nino and each year is different.
Next week I’ll publish Part II of our El Nino series (available here), when I’ll look back at past El Nino events and will see which areas of the United States received the most (and least) snow during those winters. The past is not a perfect guide to the future, but it can help.
Then in Part III of the series (posted here), I’ll show a few snow forecasts for the upcoming winter and talk about the most likely outcomes.
Stay tuned!
JOEL GRATZ
About The Author


