News

By Sam Collentine, Meteorologist Updated 3 months ago March 28, 2025
NEW: Forecast Range Graphs
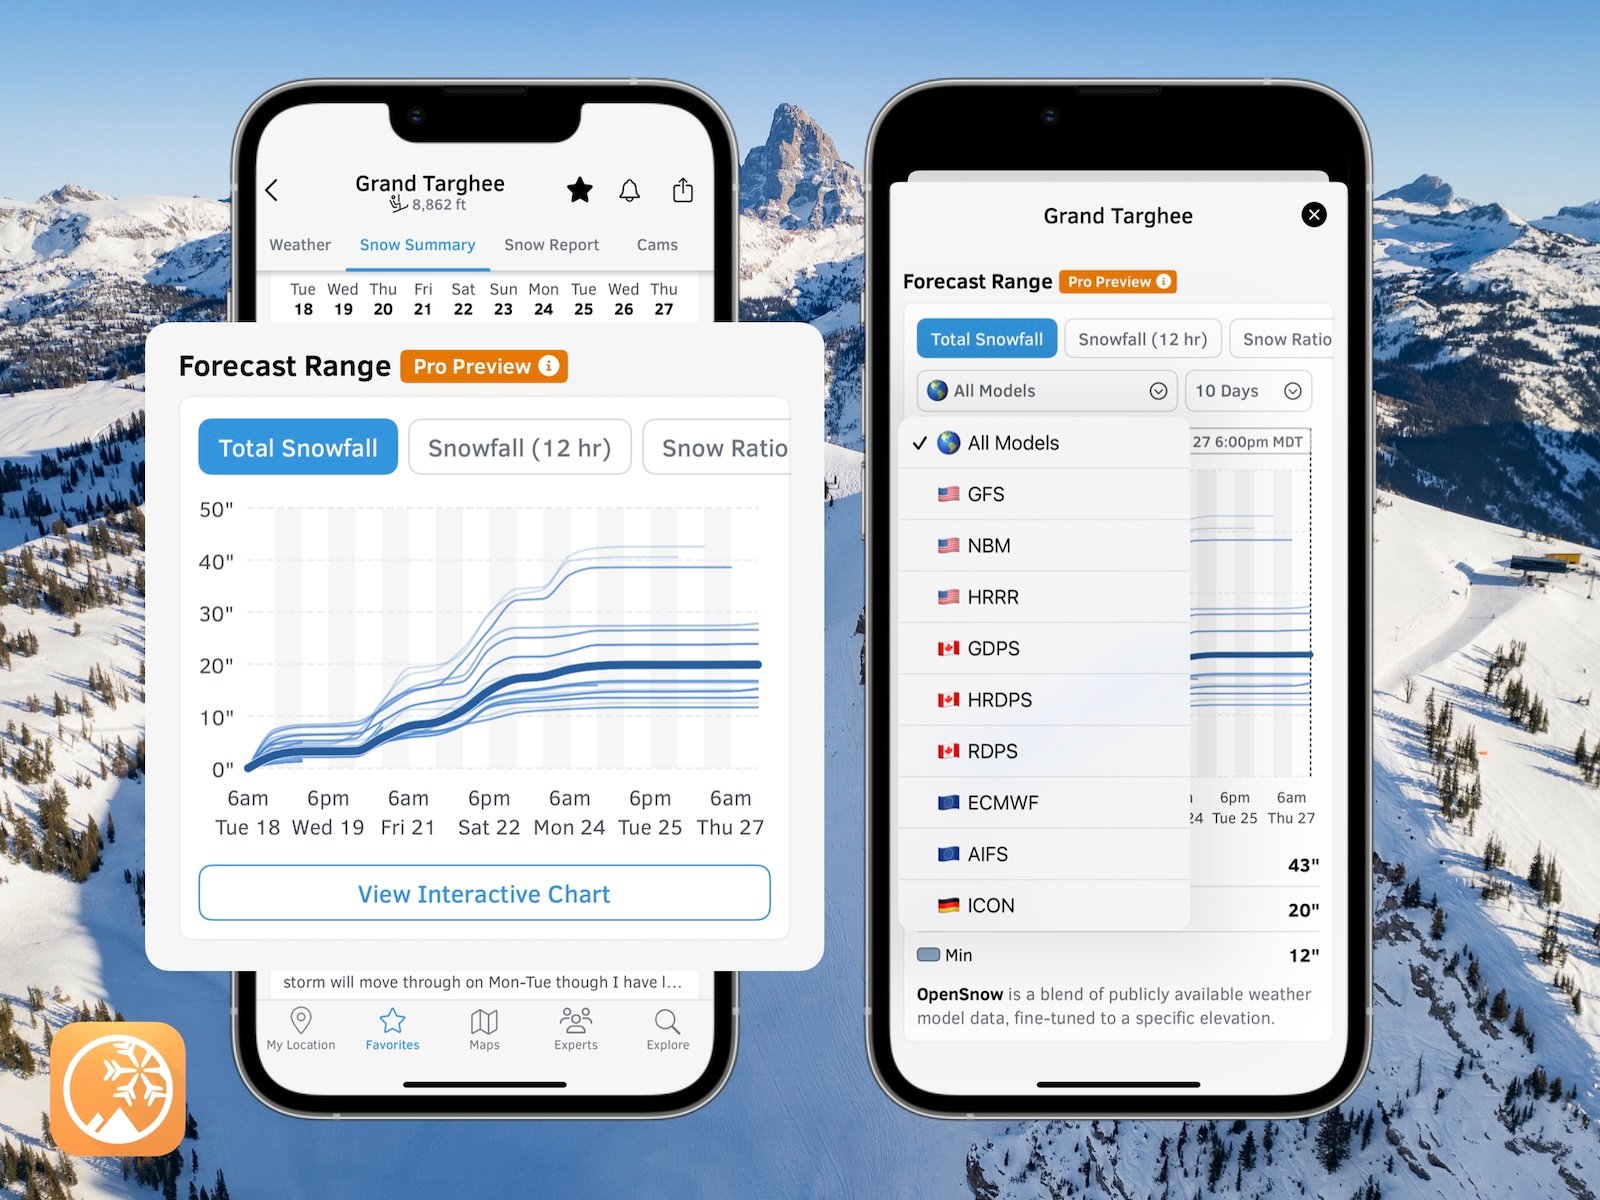
View individual forecasts from global and regional high-resolution weather models in OpenSnow. This includes forecasts from the GFS, ECMWF, HRRR, and ICON models, as well as the OpenSnow blend.
The graphs give you a behind-the-scenes look at the forecast and make it easier to see if the forecast models are in tight agreement or if there is a wide range of potential outcomes over the next 10 days.
Pro Preview: This feature will move to a new "Pro" subscription plan later in 2025.
Getting Started
- Go to any location screen.
- Scroll down under "Weather" or "Snow Summary".
- Tap "View Interactive Chart" in the app.
- Adjust the model, timeframe, or data view.

Why is the Forecast Range helpful?
Understand if there is high or low confidence in the forecast. If all models show a similar forecast, there is higher confidence in the forecast, and vice versa.
Dig into the details. If you have experience looking at weather model data and trust certain models or higher-resolution models, you'll be able to isolate your favorite data.
What forecast models are available to view?
The default "All Models" view shows all available models for that weather variable and that geography. The thick line represents the official OpenSnow forecast, which blends multiple models.
- American (GFS): 13 km resolution. Learn more.
- American Blend (NBM): 2.5 km resolution. Learn more.
- American Hi-Res (HRRR): 3 km resolution. Learn more.
- Canadian (GDPS): 15 km resolution. Learn more.
- Canadian (RDPS): 10 km resolution. Learn more.
- Canadian Hi-Res (HRDPS): 2.5 km resolution. Learn more.
- European (ECMWF): 25 km resolution. Learn more.
- European AI (AIFS): 25 km resolution. Learn more.
- German (ICON): 13 km resolution. Learn more.
- German EU (ICON-EU): 7 km resolution. Learn more.
- German D2 (ICON-D2): 2 km resolution. Learn more.
Not all models are available for all weather variables or all geographies.
What weather data is available to view?
You can toggle the graphics between:
- Total Snowfall
- Snowfall (12 hr) available in the 10-day view
- Snowfall (6 hr) available in the 5-day view
- Snowfall (3 hr) available in the 3-day view
- Snowfall (1 hr) available in the 1-day view
- Snow Ratio
- Snow Level (the elevation at which snow turns to rain)
- Temperature
- Total Precip
- Precip (12 hr) available in the 10-day view
- Precip (6 hr) available in the 5-day view
- Precip (3 hr) available in the 3-day view
- Precip (1 hr) available in the 1-day view
- Wind Speed
- Wind Gust
What do the lines and dots mean?
Each line and/or dot represents one run from the individual weather models. Most models are run/updated every 6-12 hours, and each run produces a different forecast. We usually show the most recent three runs of each weather model, with thinner lines showing previous model runs.
Mouse over or tap on any line and/or dot to see a pop-up with more information.
How are models compared?
When viewing "All Models", the data readout compares the maximum, minimum, and the official OpenSnow forecast. For other models, the data readout compares the official OpenSnow forecast and the selected model, with an additional +/- percentage that denotes the difference between the official OpenSnow forecast and the selected model.
View → Forecast Range Graphs
Questions? Send an email to [email protected] and we'll respond within 24 hours. You can also visit our Support Center to view frequently asked questions and feature guides.
Sam Collentine
About The Author


