News
By Luke Stone, Forecaster Posted 9 months ago October 16, 2024
2024-2025 Washington Winter Forecast Preview

For the upcoming 2024-2025 winter season, weak La Niña conditions are favored.
Before getting into the details of what that could mean for Washington, it's important to remember that any winter outlook will contain an inherent degree of uncertainty.
Long-range forecasts are rarely accurate. These forecasts cover 3-6 months but we know that skiing quality improves and degrades with storm cycles that last a few days to a week.
La Niña, Explained
The term La Niña refers to the large-scale ocean-atmosphere climate phenomenon linked to the periodic cooling of sea-surface temperatures across the central and east-central equatorial Pacific.
La Niña represents the cool phase of the ENSO cycle and means that the sea-surface temperatures are cooler than average.
Ski Season Snowfall vs. La Niña
The map below shows winter snowfall during seven La Niña episodes. The lower the number, the stronger the La Niña. The blue dots are above average, the white dots are average, and the orange dots are below average snowfall.

La Niña Forecast for the Winter of 2024-2025
"ENSO Neutral" conditions (neither La Niña nor El Niño) have persisted through the summer of 2024 and well into October as well. Long-range models have been projecting a higher-than-average chance of a La Niña taking over during the winter of 2024-2025.

Image: NOAA Forecast showing the probability of an El Niño, La Niña, and Neutral phase for each three-month period between the summer of 2024 and the spring of 2025. Red bars show the percent chance of an El Niño and the “DJF” label is for “December-January-February”.
The weekly Nino-3.4 region index (sea-surface temperatures in the east-central Pacific) anomaly has dropped from 1.8°C during the 2023-2024 winter season to -0.1°C as of September 9, 2024.
Long-range models are projecting this to be a weak La Niña episode with sea-surface temperatures ranging from -0.5 to -1.0ºC in the east-central Pacific.
A similar change from El Niño to a weak La Niña last occurred ahead of the 2016-2017 winter season.
We have identified six winters since 1990 in which weak La Niña conditions were present:
- 2000-2001
- 2005-2006
- 2008-2009
- 2016-2017
- 2017-2018
- 2022-2023
We will use these winter seasons that featured a weak La Niña as “analog” years for this analysis.
Historical Weak La Niña Seasons @ Mt. Baker
After looking back at the six weak La Niña winters and comparing them against the 30-year median snow water equivalent (SWE) on March 31 of 29 inches at the nearby Wells Creek SNOTEL station, I've found that the median SWE during those years is 31.0 inches on March 31 or 106% compared to the 30-year normal.
SWE on March 31 During La Niña
- 1991-2020: 29" (30-year normal)
- 2000-2001: 18.6" (63%)
- 2005-2006: 29.3" (100%)
- 2008-2009: 26.9" (92%)
- 2016-2017: 34.8" (119%)
- 2017-2018: 45" (154%)
- 2022-2023: 32.7" (112%)
Two out of the six La Niña years produced well above-normal snowfall, three produced near-normal snowfall, and one produced well below-normal snowfall.
For timing, when looking at the change in SWE each month during those years and comparing them against the 30-year median change in SWE for that month:
- November: 7 (233%)
- December: 5 (63%)
- January: 6 (86%)
- February: 7 (100%)
- March: 6 (150%)
This gives us a signal that the shoulder seasons could be above-normal, while the core winter months could be below-normal.
Historical Weak La Niña Seasons @ Stevens Pass

After looking back at the six weak La Niña winters and comparing them against the 30-year median snow water equivalent (SWE) on March 31 of 36 inches at the Stevens Pass SNOTEL station at Stevens Pass, I've found that the median SWE during those years is 39.1 inches on March 31 or 108% compared to the 30-year normal.
SWE on March 31 During La Niña
- 1991-2020: 36" (30-year normal)
- 2000-2001: 23.2" (64%)
- 2005-2006: 45.1" (125%)
- 2008-2009: 34.1" (94%)
- 2016-2017: 41.2" (114%)
- 2017-2018: 45.8" (127%)
- 2022-2023: 37" (102%)
Three out of the six La Niña years produced above-normal snowfall, two produced near-normal snowfall, and one produced well below-normal snowfall.
For timing, when looking at the change in SWE each month during those years and comparing them against the 30-year median change in SWE for that month:
- November: 5.0 (100%)
- December: 10 (100%)
- January: 7 (54%)
- February: 7 (175%)
- March: 10.1 (253%)
This gives us a signal that the late season could be well above-normal, while the early season is near average, with January well below-normal.

Historical Weak La Niña Seasons @ Snoqualmie Pass

After looking back at the six weak La Niña winters and comparing them against the 30-year median snow water equivalent (SWE) on March 31 of 53 inches at the nearby Olallie Meadows SNOTEL station, I've found that the median SWE during those years is 54.3 inches on March 31 or 102% compared to the 30-year normal.
SWE on March 31 During La Niña
- 1991-2020: 53" (30-year normal)
- 2000-2001: 36.1" (68%)
- 2005-2006: 67.4" (126%)
- 2008-2009: 51.2" (96%)
- 2016-2017: 56.5" (106%)
- 2017-2018: 53.4 (100%)
- 2022-2023: 55.2 (103%)
One out of the six La Niña years produced well above-normal snowfall, four produced near-normal snowfall, and one produced well below-normal snowfall.
For timing, when looking at the change in SWE each month during those years and comparing them against the 30-year median change in SWE for that month:
- November: 2 (133%)
- December: 11 (85%)
- January: 10 (77%)
- February: 14 (156%)
- March: 11.3 (94%)
This gives us a signal that the early and late seasons could be well above-normal, while the early-middle season could be below average.
Historical Weak La Niña Seasons @ Crystal Mountain

After looking back at the six weak La Niña winters and comparing them against the 30-year median snow water equivalent (SWE) on March 31 of 53 inches at the Morse Lake SNOTEL station, I've found that the median SWE during those years is 49.2 inches on March 31 or 93% compared to the 30-year normal.
SWE on March 31 During La Niña
- 1991-2020: 53" (30-year normal)
- 2000-2001: 26.8" (50%)
- 2005-2006: 67.8" (128%)
- 2008-2009: 37.9" (71%)
- 2016-2017: 51.3" (97%)
- 2017-2018: 54" (102%)
- 2022-2023: 47.1" (89%)
One out of the six La Niña years produced well above-normal snowfall, three produced near-normal snowfall, and two produced well below-normal snowfall.
For timing, when looking at the change in SWE each month during those years and comparing them against the 30-year median change in SWE for that month:
- November: 9 (100%)
- December: 11 (85%)
- January: 7 (47%)
- February: 10 (143%)
- March: 10.2 (113%)
This signals that the shoulder seasons could be near-normal, while the December through January could be below-normal, with February well above-normal.

Historical Weak La Niña Seasons @ White Pass
After looking back at the six weak La Niña winters and comparing them against the 30-year median snow water equivalent (SWE) on March 31 of 22 inches at the White Pass SNOTEL station, I've found that the median SWE at White Pass during those years is 24.5 inches on March 31 or 114% compared to the 30-year normal.
SWE on March 31 During La Niña
- 1991-2020: 22" (30-year normal)
- 2000-2001: 11.9 (55%)
- 2005-2006: 27.3 (127%)
- 2008-2009: 24.7 (115%)
- 2016-2017: 26.5 (123%)
- 2017-2018: 20.1 (93%)
- 2022-2023: 24.3 (113%)
Three out of the six La Niña years produced well above-normal snowfall, two produced near-normal snowfall, and one produced well below-normal snowfall.
For timing, when looking at the change in SWE each month during those years and comparing them against the 30-year median change in SWE for that month:
- November: 3 (100%)
- December: 7 (117%)
- January: 4 (80%)
- February: 4 (80%)
- March: 6.5 (217%)
This gives us a signal that the late season could be well above-normal, while the early season is near average, with January through February well below-normal.
Historical Weak La Niña Seasons @ Mt. Spokane
After looking back at the six weak La Niña winters and comparing them against the 30-year median snow water equivalent (SWE) on March 31 of 19 inches at the nearby Quartz Peak SNOTEL station, I've found that the median SWE at Mt. Spokane during those years is 21.7 inches on March 31 or 115% compared to the 30-year normal.
SWE on March 31 During La Niña
- 1991-2020: 19" (30-year normal)
- 2000-2001: 10.8" (57%)
- 2005-2006: 25.1" (134%)
- 2008-2009: 22.1" (118%)
- 2016-2017: 19.4" (103%)
- 2017-2018: 21.3" (113%)
- 2022-2023: 22.8" (121%)
Three out of the six La Niña years produced well above-normal snowfall, two produced near-normal snowfall, and one produced well below-normal snowfall.
For timing, when looking at the change in SWE each month during those years and comparing them against the 30-year median change in SWE for that month:
- November: 3 (75%)
- December: 4 (80%)
- January: 7 (140%)
- February: 4 (80%)
- March: 3.7 (370%)
This signals an inconsistent season following a slow start with potentially a strong finish.
Historical Weak La Niña Seasons @ Hurricane Ridge
After looking back at the six weak La Niña winters and comparing them against the 30-year median snow water equivalent (SWE) on March 31 of 29 inches at the nearby Waterhole SNOTEL station, I've found that the median SWE during those years is 33.8 inches on March 31 or 115% compared to the 30-year normal.
SWE on March 31 During La Niña
- 1991-2020: 29" (30-year normal)
- 2000-2001: 20" (68%)
- 2005-2006: 39.6" (135%)
- 2008-2009: 27.3" (93%)
- 2016-2017: 44.7" (153%)
- 2017-2018: 46" (157%)
- 2022-2023: 28" (96%)
Three out of the six La Niña years produced well above-normal snowfall, two produced near-normal snowfall, and one produced well below-normal snowfall.
For timing, when looking at the change in SWE each month during those years and comparing them against the 30-year median change in SWE for that month:
- November: 7 (233%)
- December: 4 (50%)
- January: 9 (113%)
- February: 7 (140%)
- March: 6.8 (136%)
This signals that the majority of the season could be above-normal with a perhaps very dry December.
Overall, history tells us that snowfall at the resorts in Washington tends to be slightly above normal during weak La Niña winters.
My graduate research focused on how sea-surface temperatures in the North Atlantic alter the typical impacts of El Niño and La Niña, which you can read more about here. A few sections from that article are summarized below.
Based on research from past seasons, we know that ocean water temperatures in the North Atlantic alter the alignment and strength of the correlation between El Niño and La Niña and winter precipitation in North America.
Just like the warming and cooling waters of the tropical Pacific Ocean, the water temperatures in the North Atlantic Ocean cycle between warmer and colder as well, and we call this cycle the Atlantic Quadpole Mode (AQM).
The changes that happen in the Atlantic Ocean do not stay in the Atlantic Ocean but rather spread across the globe. This is similar to how the changes that happen in the Pacific Ocean during El Niño and La Niña spread their effects around the world.
For a winter season with La Niña and a warm AQM, as is expected this season, the wetter/snowier areas extend farther south than a typical La Niña, due to a southerly shift in the storm track. This decreases the chances of above-normal precipitation in Washington during the winter.
Further, the impacts of a weak La Niña are much less pronounced than during moderate or strong events, further decreasing the expectation of ENSO-related precipitation anomalies. Finally, with the delayed onset of La Niña, any impacts that may result from this ENSO phase could be delayed as well.

Conclusion
Based on all of the available information, I think the weak La Niña will have only a minor impact at most on snowfall in Washington, with increased chances for slightly above-normal snowfall. It is more likely that smaller scale and shorter duration atmospheric patterns will determine the fate of our resorts this winter.
When it comes to finding the best conditions for skiers and snowboarders, it’s all about timing. To have the best chance of enjoying the deepest powder, our recommendation is to dial in your plans 7-10 days in advance.
Sometimes, longer-range forecasts can identify possible storms 1-2 weeks (or longer) in advance, but often, forecast confidence in the details of each storm only begins to increase when the system is about one week away or closer.
Upgrade to OpenSnow All-Access for 10-day snow forecasts, expert local analysis, and custom snow alerts to help you find the deepest snow and the best ski conditions all winter long.

Every OpenSnow All-Access subscription is also good for 365 days.
- 10-Day Snow Forecasts
- Expert Local Forecasters
- Custom Snow Alerts
- 3D Snowfall Maps
- Snow Forecast & Report Widgets
- 10-Day Hourly Forecasts
- Current & Forecast Radar
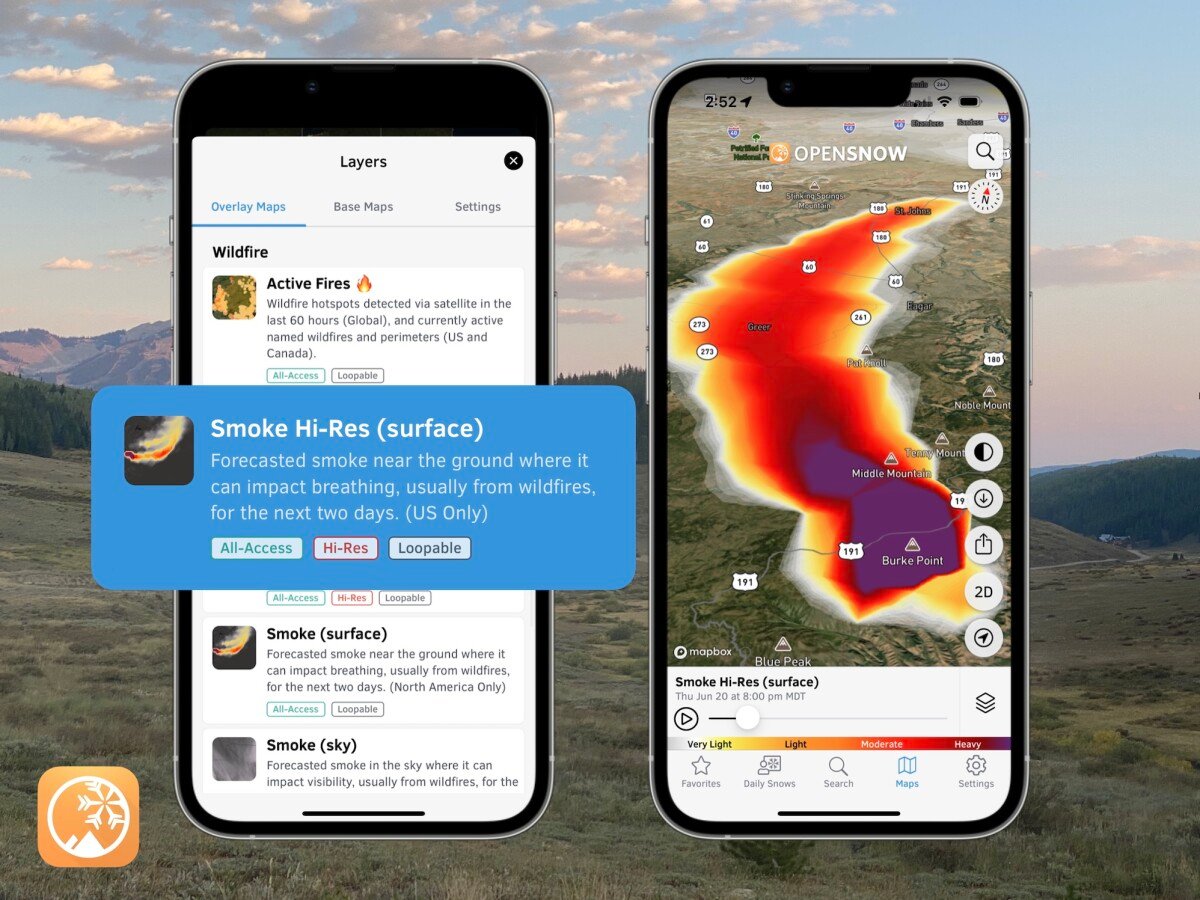
- Active Fire & Smoke Maps
- Lightning Risk Forecasts
- Offline Satellite & Terrain Maps
"The OpenSnow app is an absolute must-have for anyone who loves winter sports or simply wants to stay informed about snow conditions. The interface is user-friendly, making it easy to access detailed weather forecasts, snow reports, and mountain updates. The accuracy of the predictions is impressive, giving me confidence in planning my ski trips." – August 2024 Review
Questions? Send an email to [email protected] and we'll respond within 24 hours. You can also visit our Support Center to view frequently asked questions and feature guides.
Luke Stone (@imlukesnow)
Forecaster, OpenSnow
About The Author